Dashboard Copilot
Transform your BI dashboards into intelligent AI subagents with a single command. This guide walks you through deploying Superset with PostgreSQL, configuring Datus, and using the bootstrap-bi command to automatically generate context and subagents from your dashboard.
Why Dashboard Copilot?
Traditional BI dashboards are static - they show predefined charts and metrics, but users cannot ask follow-up questions or explore data beyond what's been pre-built. Datus Dashboard Copilot transforms these static dashboards into dynamic analysis copilots that can:
- Answer ad-hoc questions using the same data and business logic as your dashboard
- Perform root cause analysis when metrics change unexpectedly
- Generate new SQL queries that stay consistent with your dashboard's semantic model
- Provide attribution analysis to explain what's driving metric changes
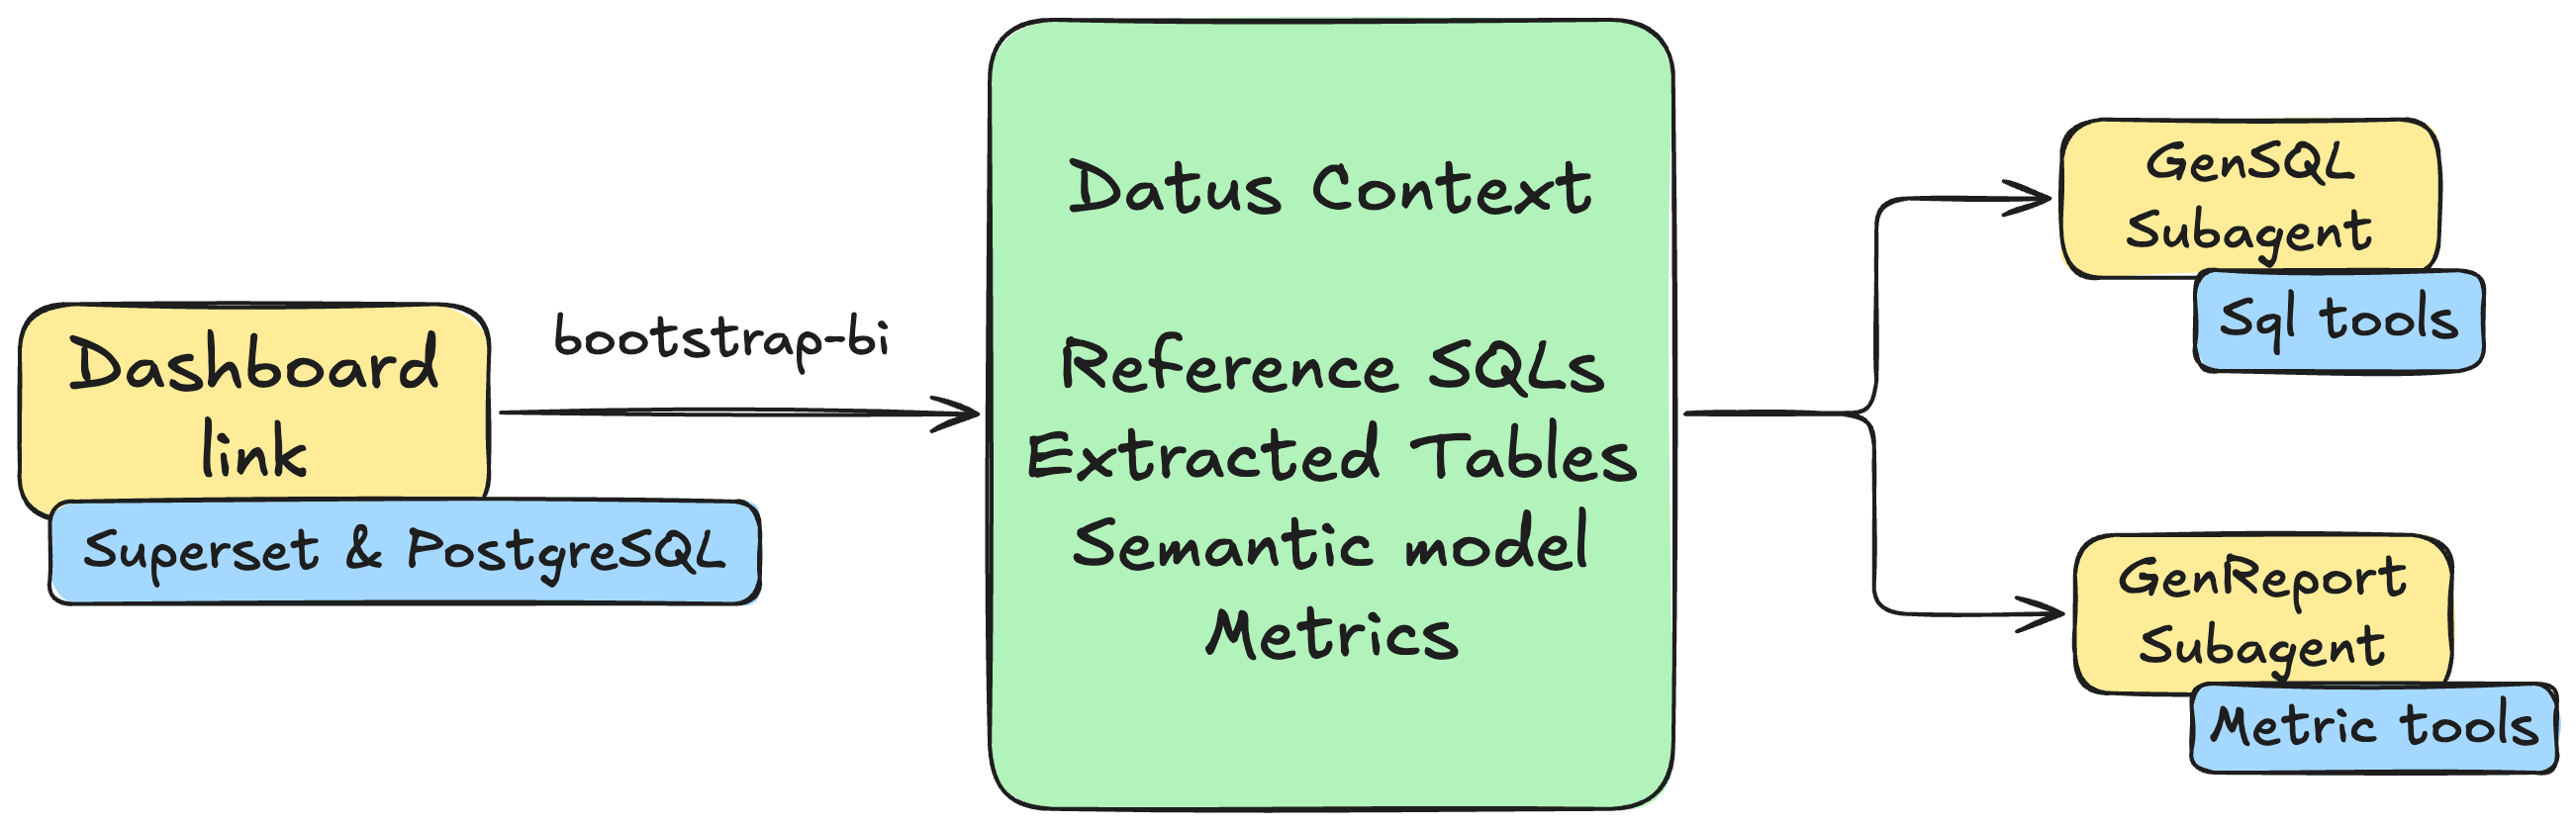
With one command, Datus extracts all the context from your existing dashboard - the SQL queries, table relationships, metrics definitions, and business logic - and creates AI subagents that understand your data as well as your dashboard does.
The bootstrap process automatically generates two specialized subagents: a GenSQL subagent that enables self-service data retrieval through SQL tools, and a GenReport subagent that provides analysis, drill-down, and attribution reports through metric tools.
Prerequisites
Before you begin, ensure you have:
- Docker Desktop installed and running
- Kubernetes CLI (
kubectl) - Helm package manager
- Python 3.12 with Datus installed
Step 1: Deploy Superset + PostgreSQL
First, install the required infrastructure tools.
Install Dependencies
# Install Docker
curl -fsSL https://get.docker.com | sh

# Install kubectl
curl -LO "https://dl.k8s.io/release/$(curl -L -s https://dl.k8s.io/release/stable.txt)/bin/linux/amd64/kubectl"
chmod +x kubectl && sudo mv kubectl /usr/local/bin/

# Install Helm
curl https://raw.githubusercontent.com/helm/helm/main/scripts/get-helm-3 | bash

# Install minikube
curl -LO https://storage.googleapis.com/minikube/releases/latest/minikube-linux-amd64
sudo install minikube-linux-amd64 /usr/local/bin/minikube
Start Minikube
Deploy Superset
Add the Superset Helm repository and deploy:
# Add Superset Helm repo
helm repo add superset https://apache.github.io/superset
helm repo update

# Deploy Superset with example configuration
helm upgrade --install superset superset/superset -n default -f ./examples-values.yaml --wait --timeout 30m
Custom Values
You can customize the deployment by modifying examples-values.yaml. See the Superset Helm Chart documentation for available options.
Wait for Pods
Monitor the deployment until all pods are running:
Wait until you see all pods in Running state before proceeding.
Set Up Port Forwarding
Expose Superset and PostgreSQL services locally:
# Forward Superset UI (port 8088)
kubectl port-forward -n default service/superset 8088:8088 > /dev/null 2>&1 &

# Forward PostgreSQL (port 15432)
kubectl port-forward -n default svc/superset-postgresql 15432:5432 > /dev/null 2>&1 &
You can now access Superset at http://localhost:8088 with default credentials admin/admin.
Step 2: Configure Datus
Configure Datus to connect to both the PostgreSQL database and Superset dashboard.
Install Required Extensions
Update agent.yml
Add the following configuration to your ~/.datus/agent.yml:
agent:
  namespace:
    superset:
      type: postgresql
      host: 127.0.0.1
      port: 15432
      username: superset
      password: superset
      database: examples
  dashboard:
    superset:
      username: admin
      password: admin
      extra:
        provider: db
Configuration Sections
- namespace: Defines the database connection for SQL execution
- dashboard: Defines the BI platform credentials for dashboard access
Step 3: Bootstrap from Dashboard
Now use the bootstrap-bi command to automatically generate context and subagents from your Superset dashboard. We'll use the World Bank's Data dashboard as an example.
Run Bootstrap Command
Interactive Flow
The command will guide you through an interactive process:
Select BI platform (superset): superset
Dashboard URL: http://localhost:8088/superset/dashboard/world_health/?native_filters_key=4X5gjZkIbnU
API base URL (e.g. https://host) (http://localhost:8088): http://localhost:8088
The system will display the dashboard information and extracted charts:
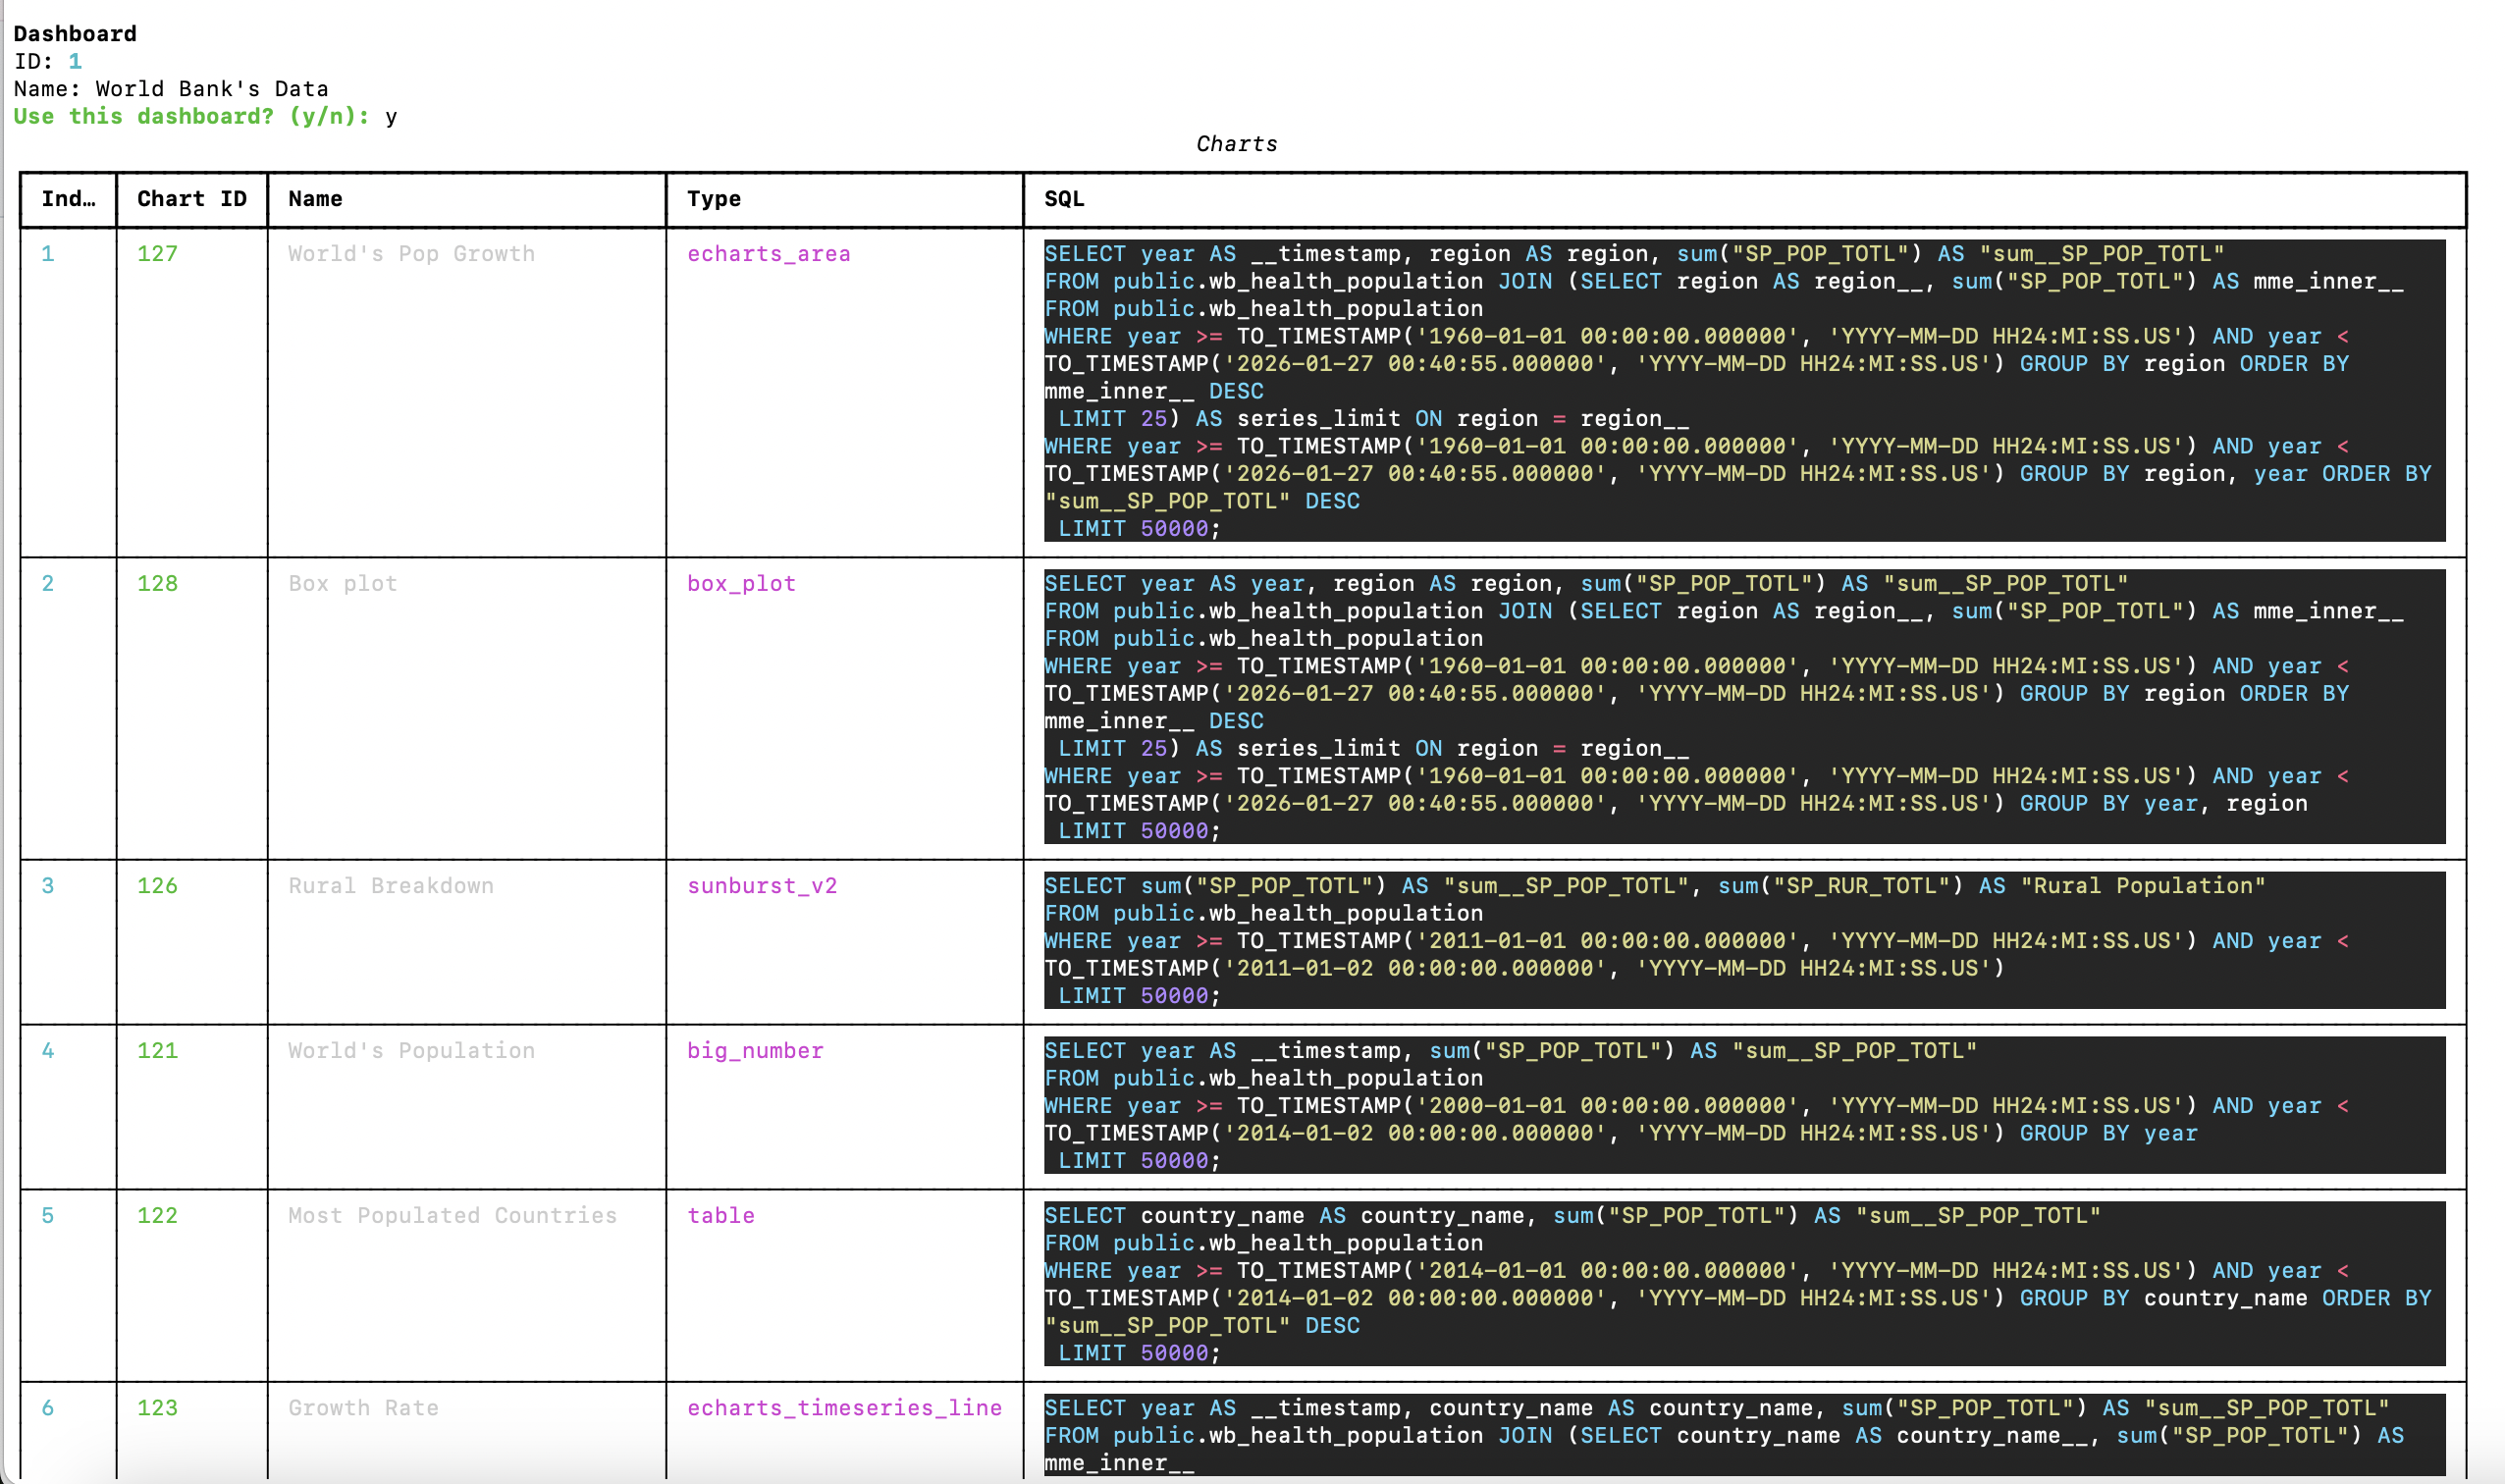
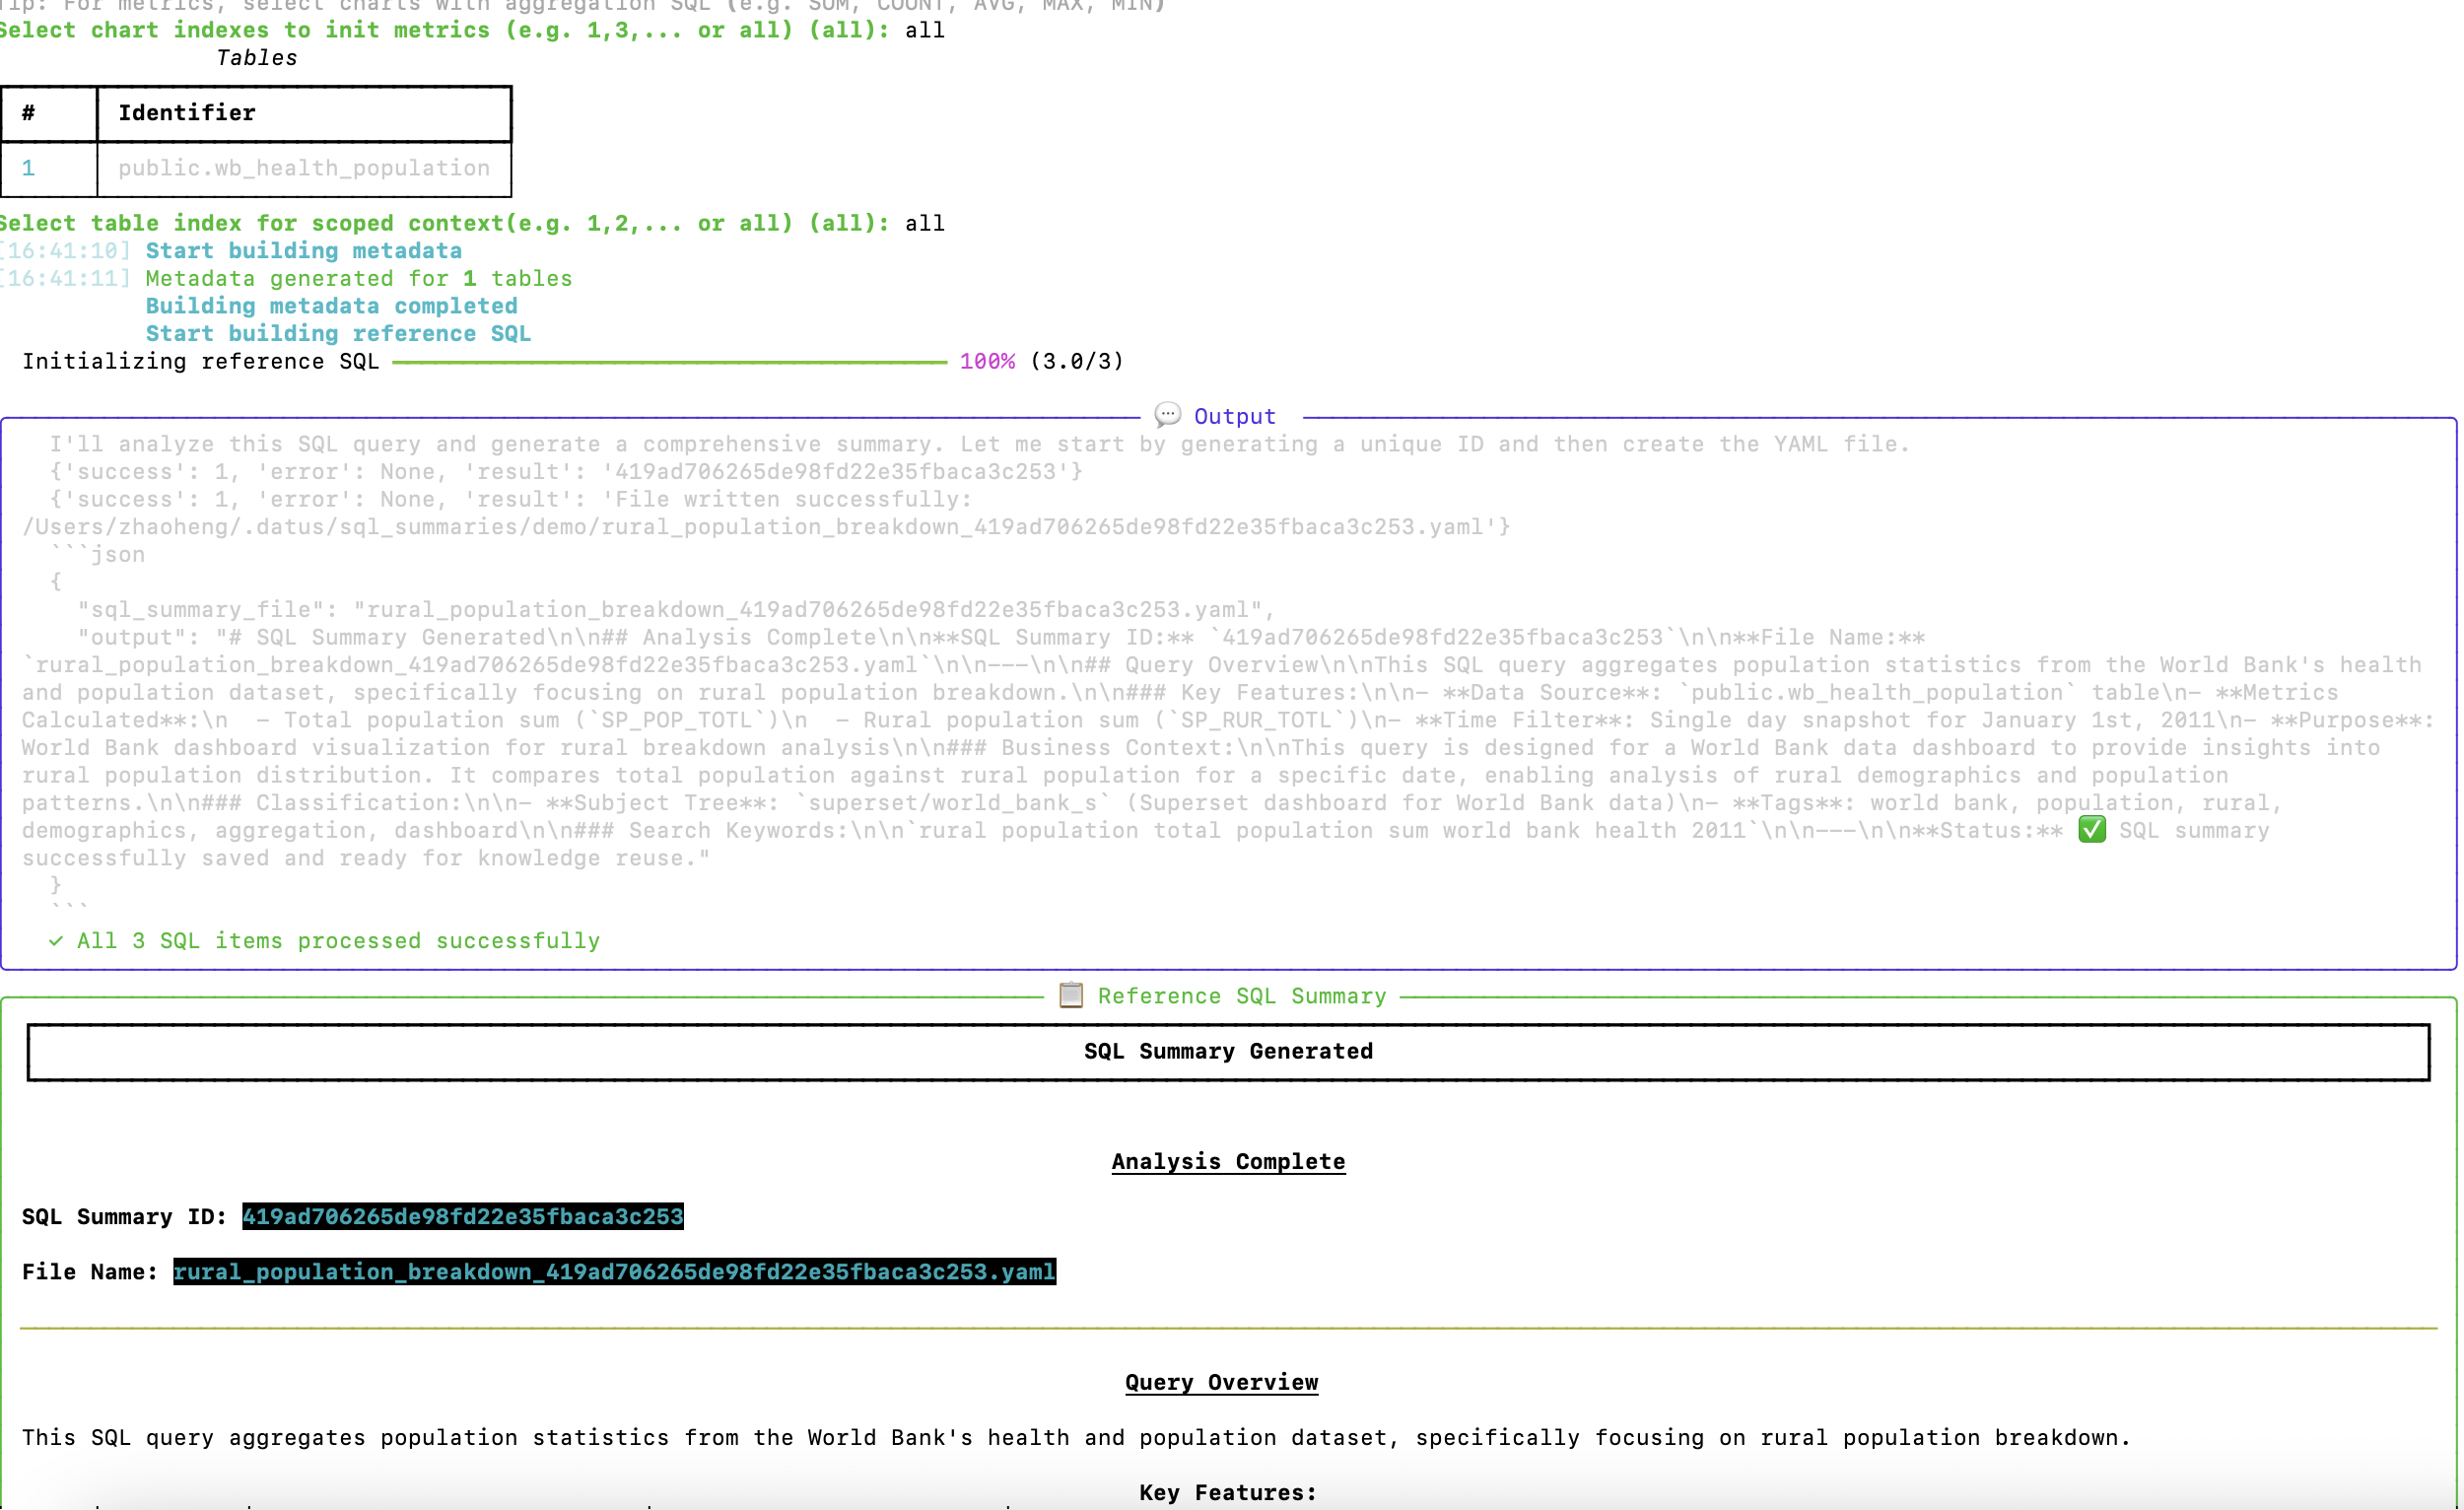
Select the charts and tables you want to include. The bootstrap process will then automatically:
1. Build Metadata and Reference SQL
The system analyzes each chart's SQL query and generates comprehensive documentation:
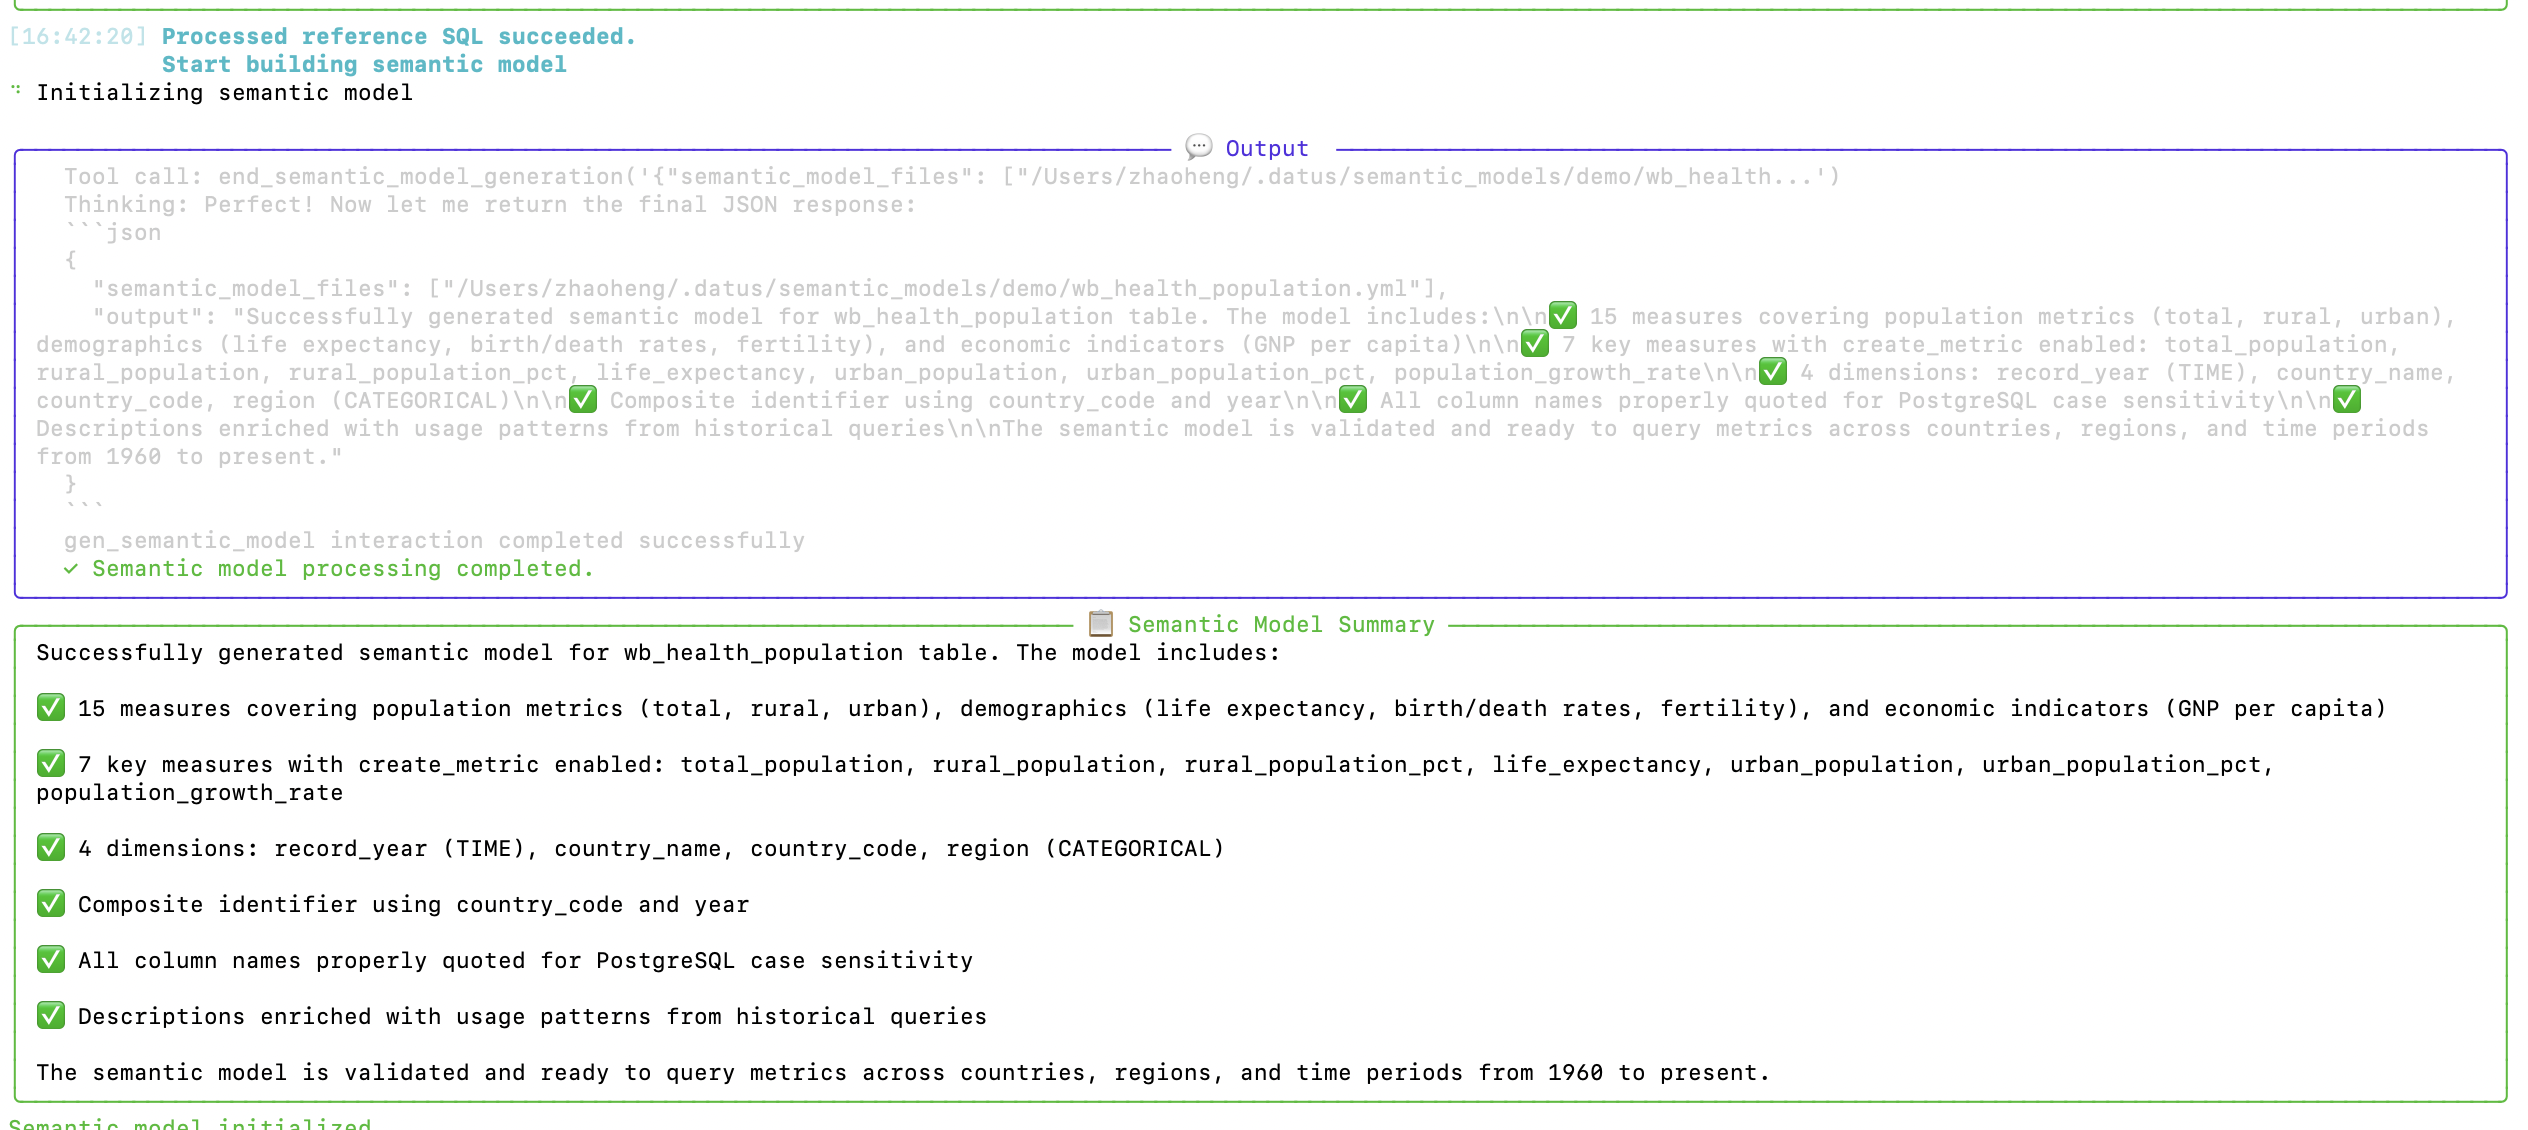
2. Generate Semantic Model
Datus creates a semantic model with measures, dimensions, and relationships:
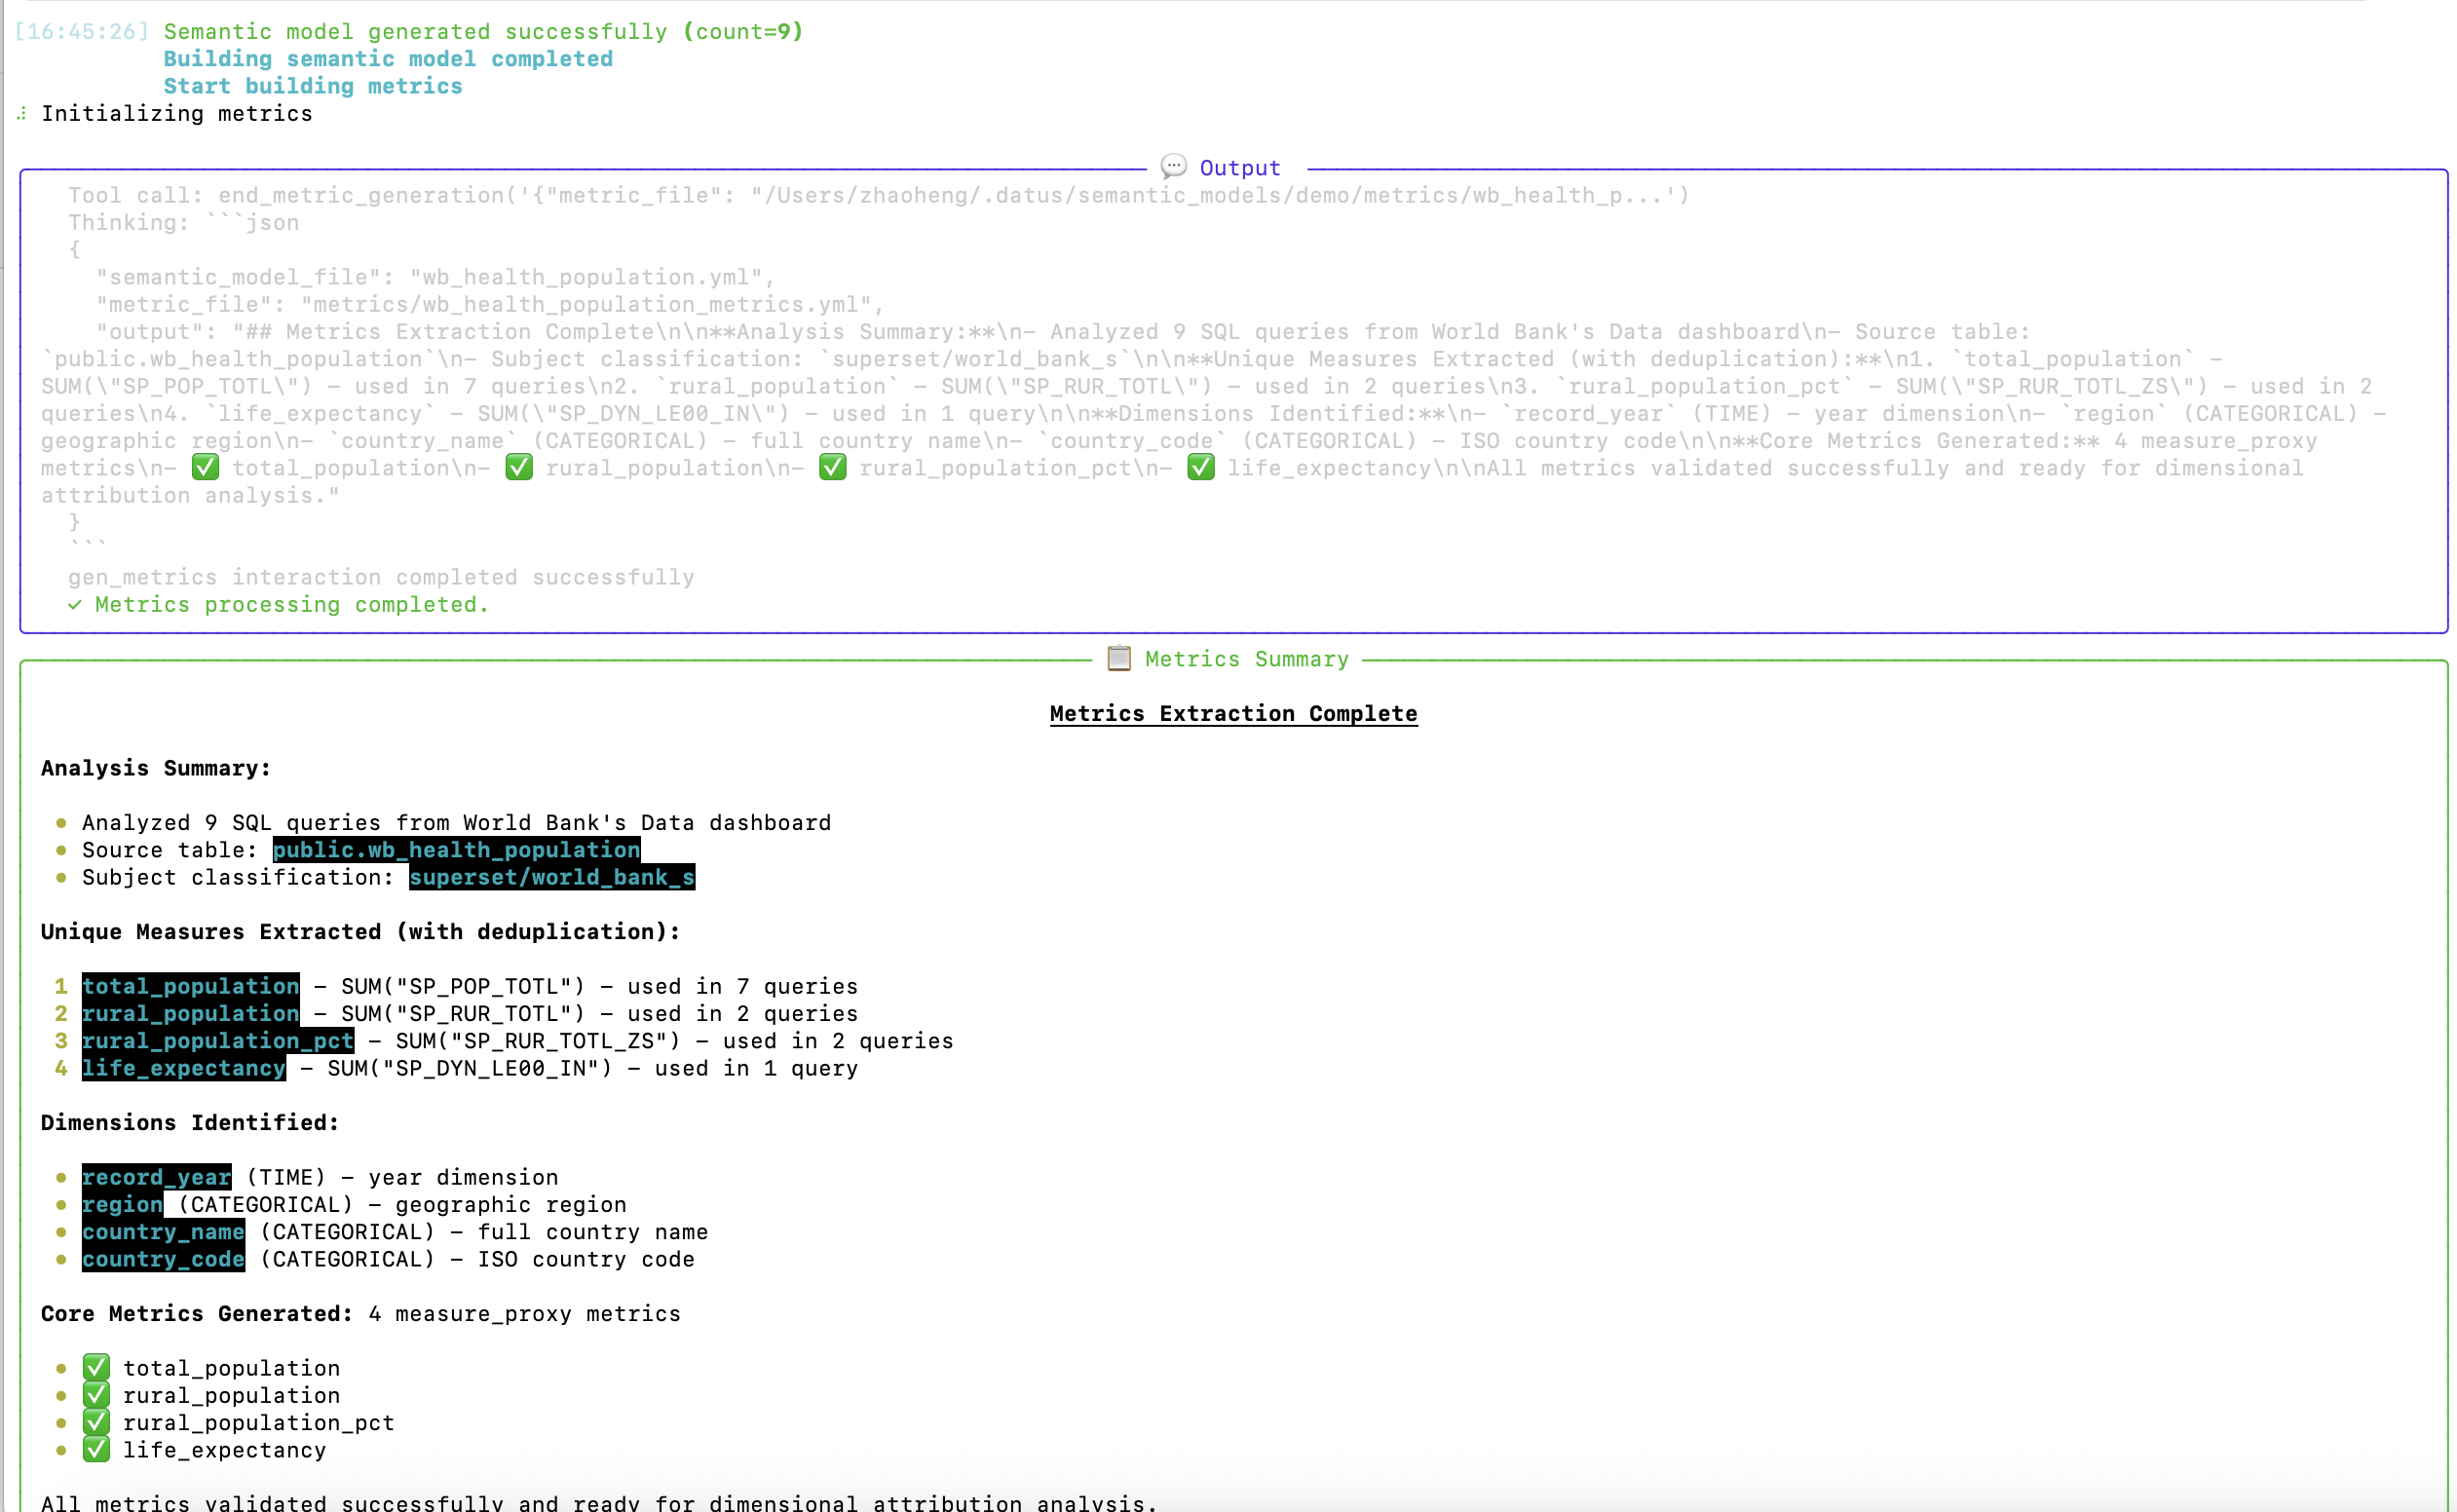
3. Extract Metrics
The system identifies and validates metrics from the dashboard queries:
Output
After the bootstrap completes, you'll have ready-to-use subagents:
Subagent `superset_world_bank_s` saved.
Subagent `superset_world_bank_s` bootstrapped.
Attribution Sub-Agent `superset_world_bank_s_attribution` saved.
Step 4: Use Attribution Analysis
The bootstrapped attribution subagent enables powerful metric analysis capabilities.
Example Query
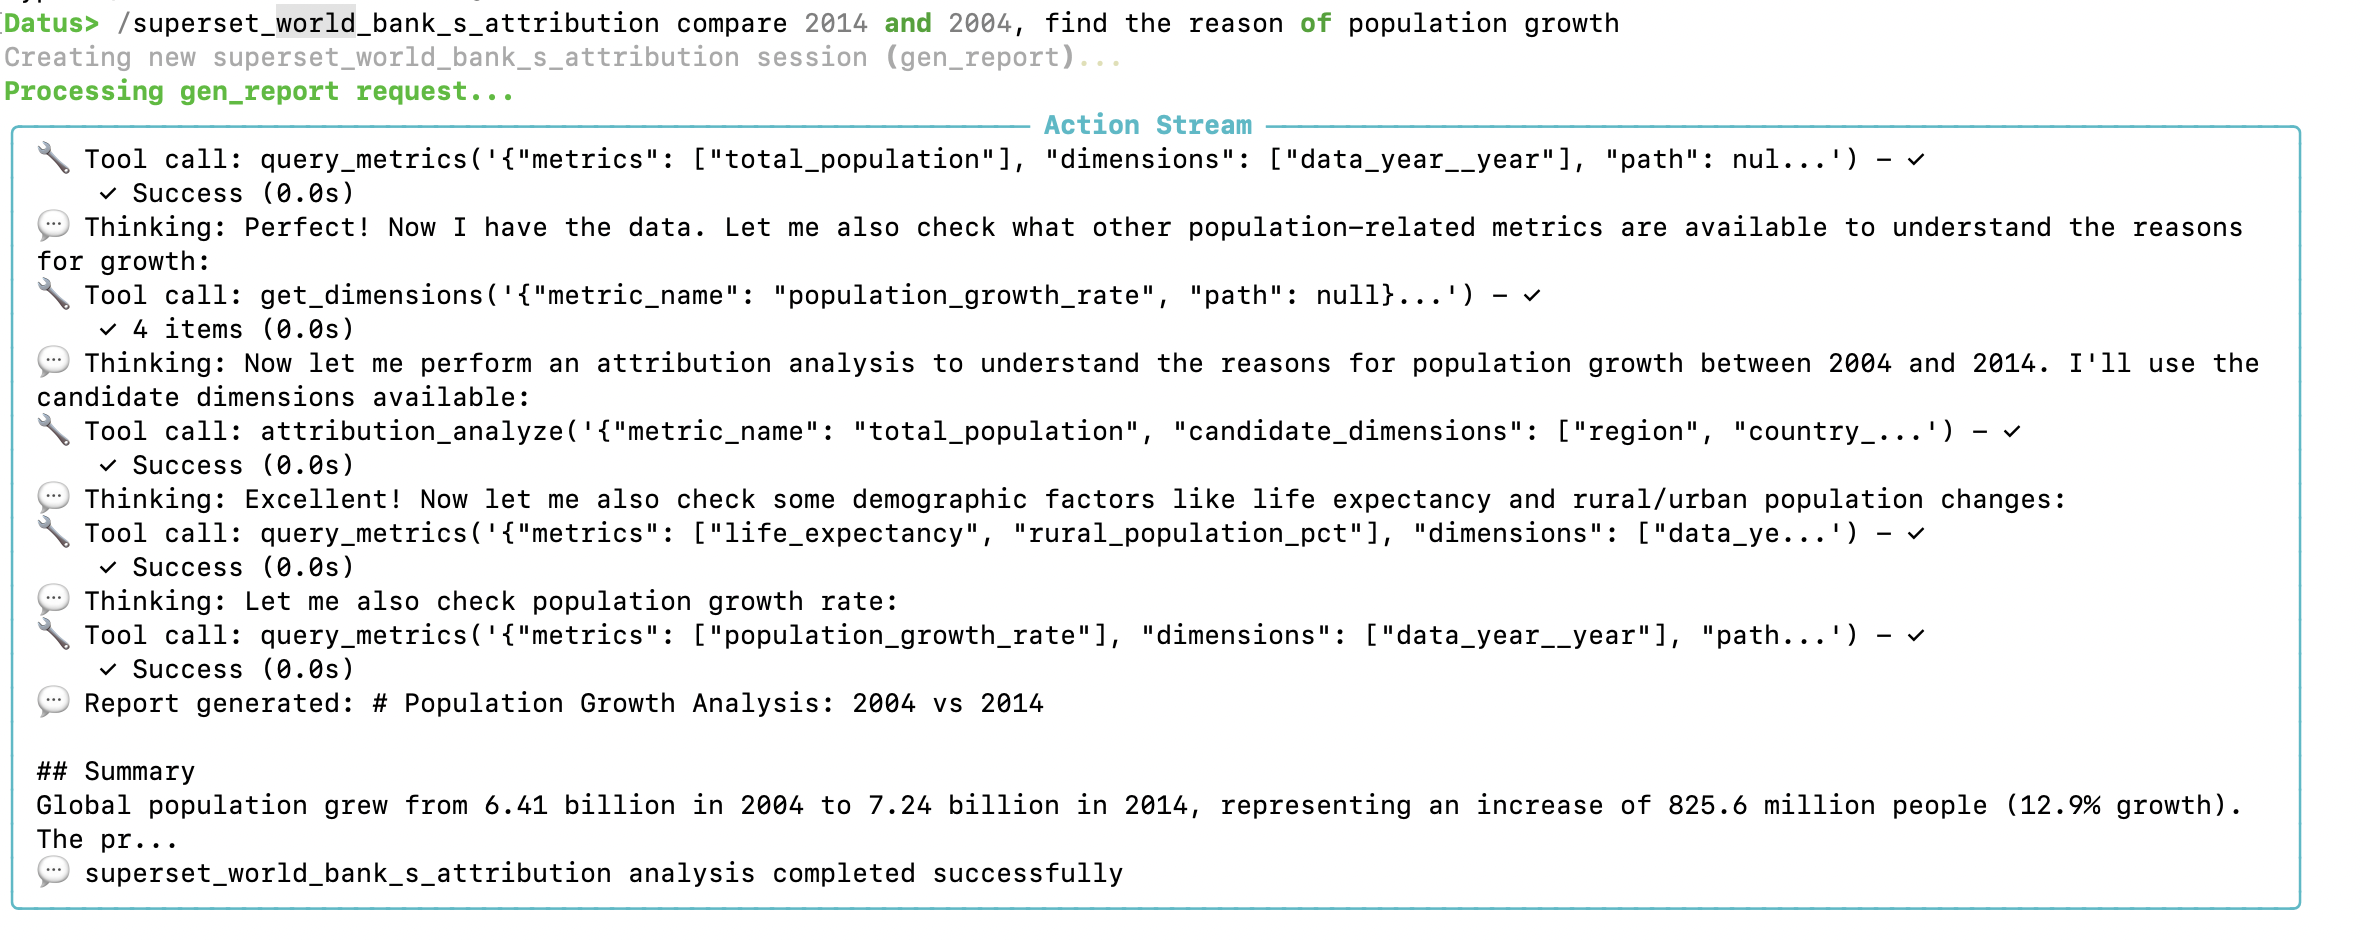
Datus> /superset_world_bank_s_attribution compare 2014 and 2004, find the reason of population growth
The agent performs multi-step analysis using the metrics and dimensions from your dashboard:
Attribution Analysis Capabilities
The attribution subagent provides:
- Automatic Dimension Importance Ranking - Identifies which dimensions most influence metric changes
- Delta Contribution Calculation - Quantifies each factor's contribution to the overall change
- Root Cause Identification - Pinpoints specific values driving metric movement
Sample Output
The analysis generates a comprehensive report with key findings:
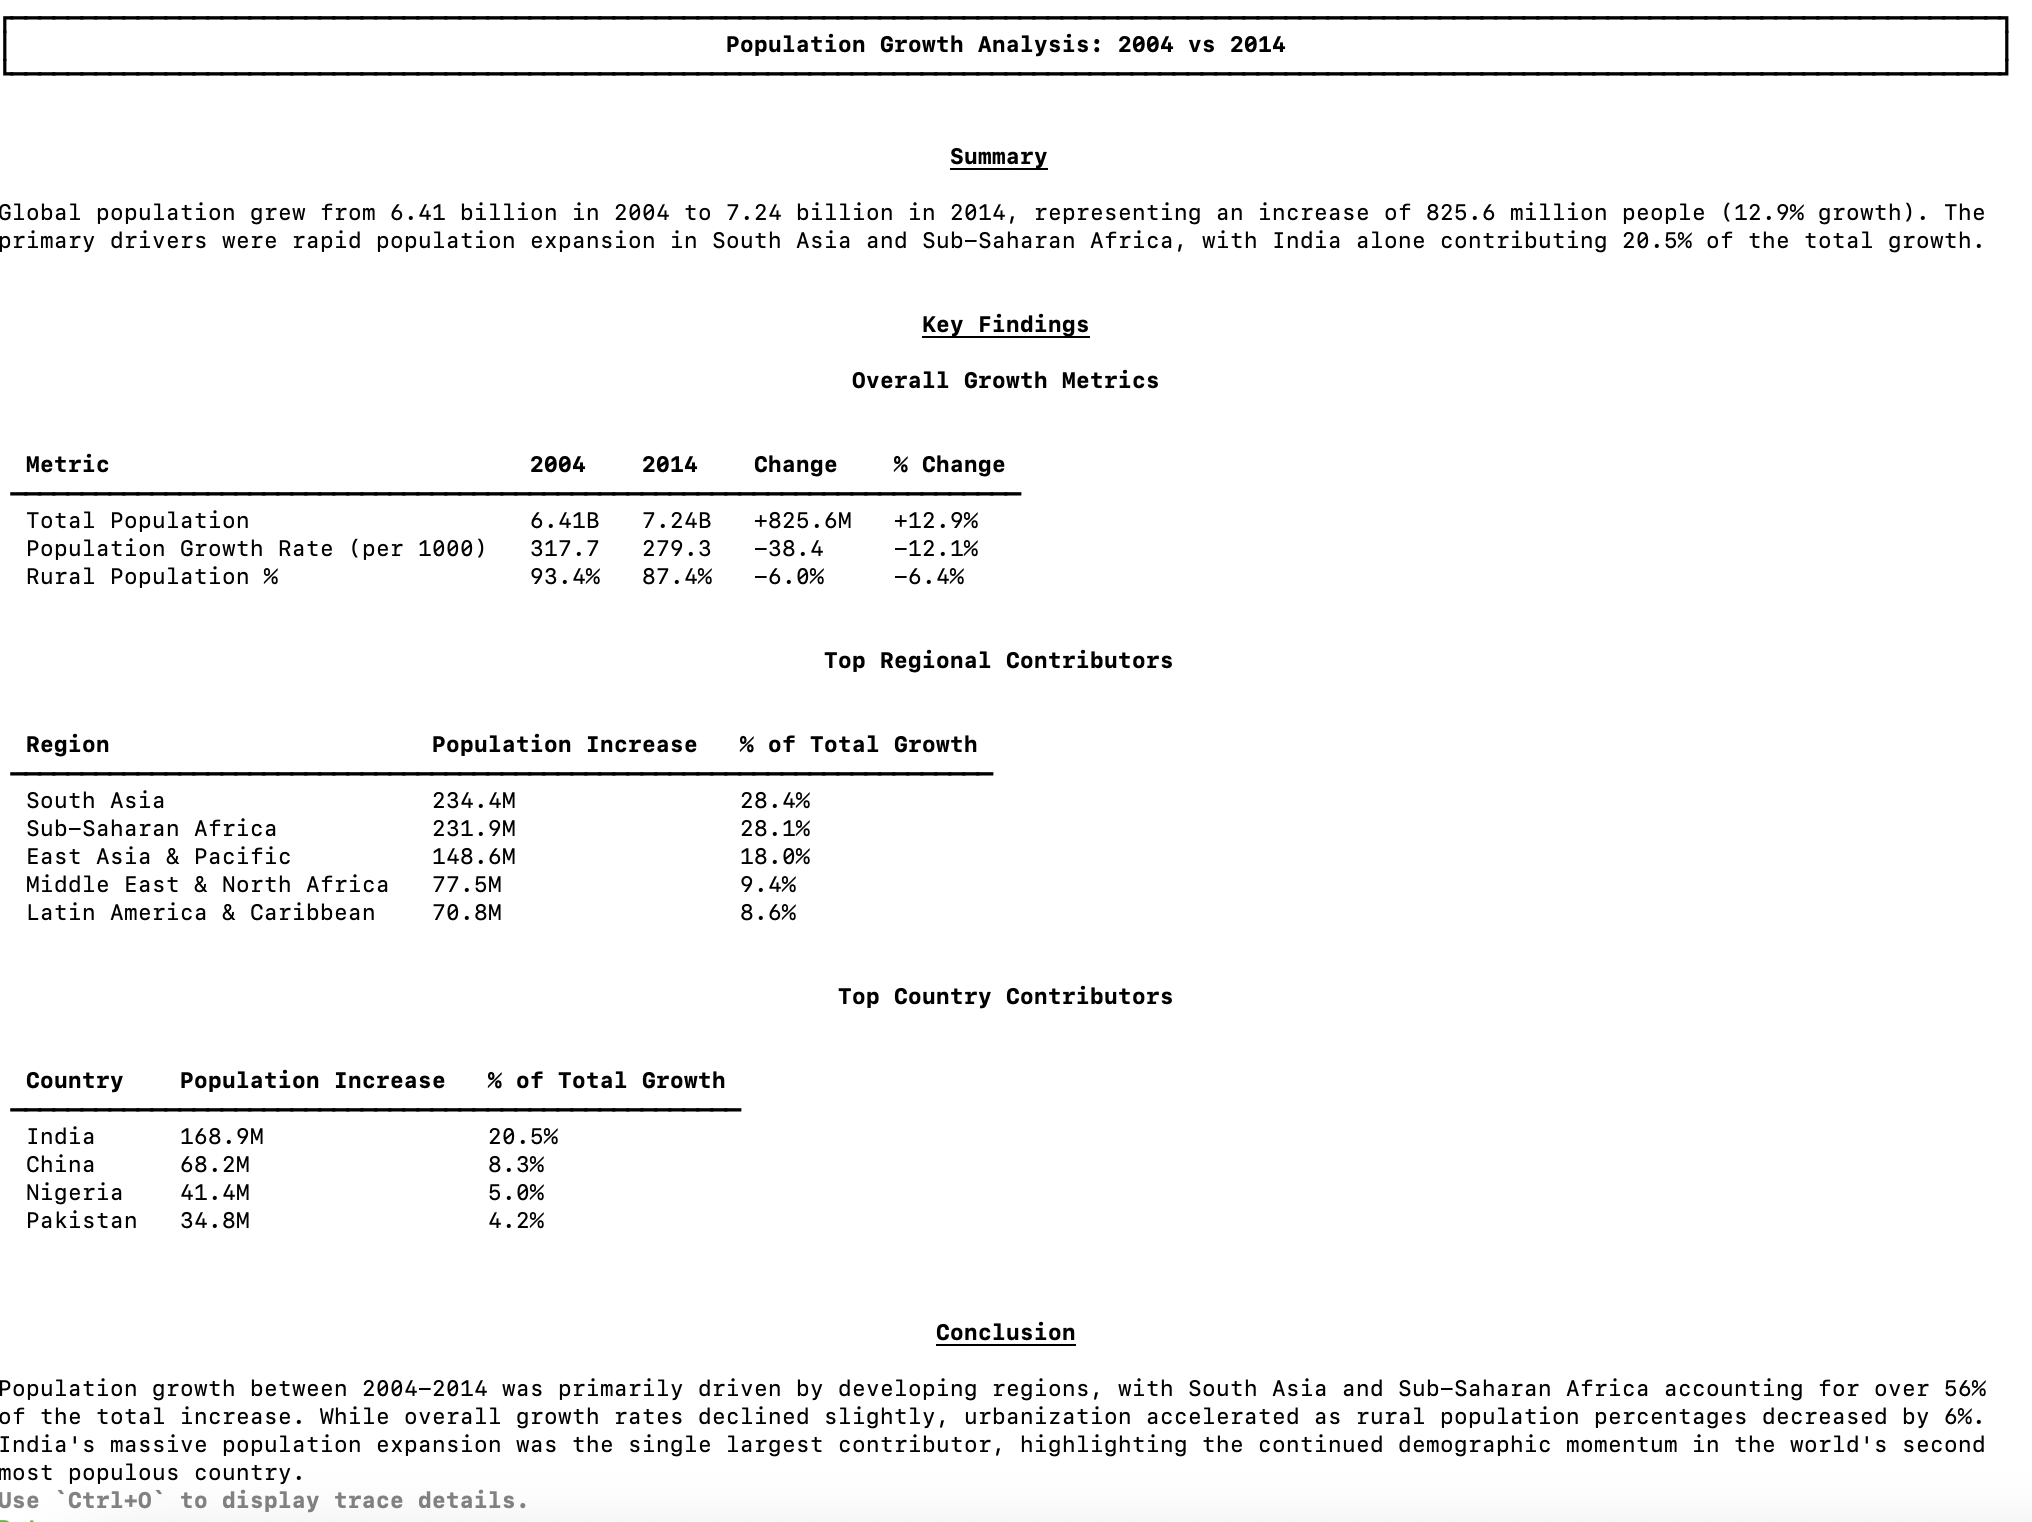
The report includes:
- Overall Growth Metrics - Comparison of total population, growth rate, and rural population percentage
- Top Regional Contributors - Which regions drove the most population increase
- Top Country Contributors - Individual country contributions to the change
- Conclusion - Summary of key insights explaining the metric movement
Generated Subagents Explained
The bootstrap-bi command creates two types of subagents:
GenSQL Subagent
The primary subagent (e.g., superset_world_bank_s) provides:
- SQL generation within the dashboard's semantic scope
- Context-aware queries using extracted metadata
- Reference SQL patterns from dashboard charts
Example usage:
GenReport Subagent (Attribution)
The attribution subagent (e.g., superset_world_bank_s_attribution) provides:
- Metric comparison and trend analysis
- Root cause analysis for metric changes
- Dimension-level attribution reports
Example usage:
Next Steps
Now that you have your dashboard-powered subagents, explore more:
- Subagent Introduction - Learn more about subagent capabilities
- Knowledge Base - Manage and extend your context
- Metrics - Define and manage your metrics
- Semantic Models - Customize your semantic layer