Dashboard Copilot
只需一条命令,即可将您的 BI 仪表盘转化为智能 AI 子代理。本指南将带您完成 Superset + PostgreSQL 的部署、Datus 配置,以及使用 bootstrap-bi 命令从仪表盘自动生成上下文和子代理。
为什么选择 Dashboard Copilot?
传统 BI 仪表盘是静态的——它们展示预定义的图表和指标,但用户无法提出后续问题或探索预构建内容之外的数据。Datus Dashboard Copilot 将这些静态仪表盘转化为动态分析助手,能够:
- 使用与仪表盘相同的数据和业务逻辑回答临时问题
- 在指标发生意外变化时进行根因分析
- 生成与仪表盘语义模型保持一致的新 SQL 查询
- 提供归因分析,解释指标变化的驱动因素
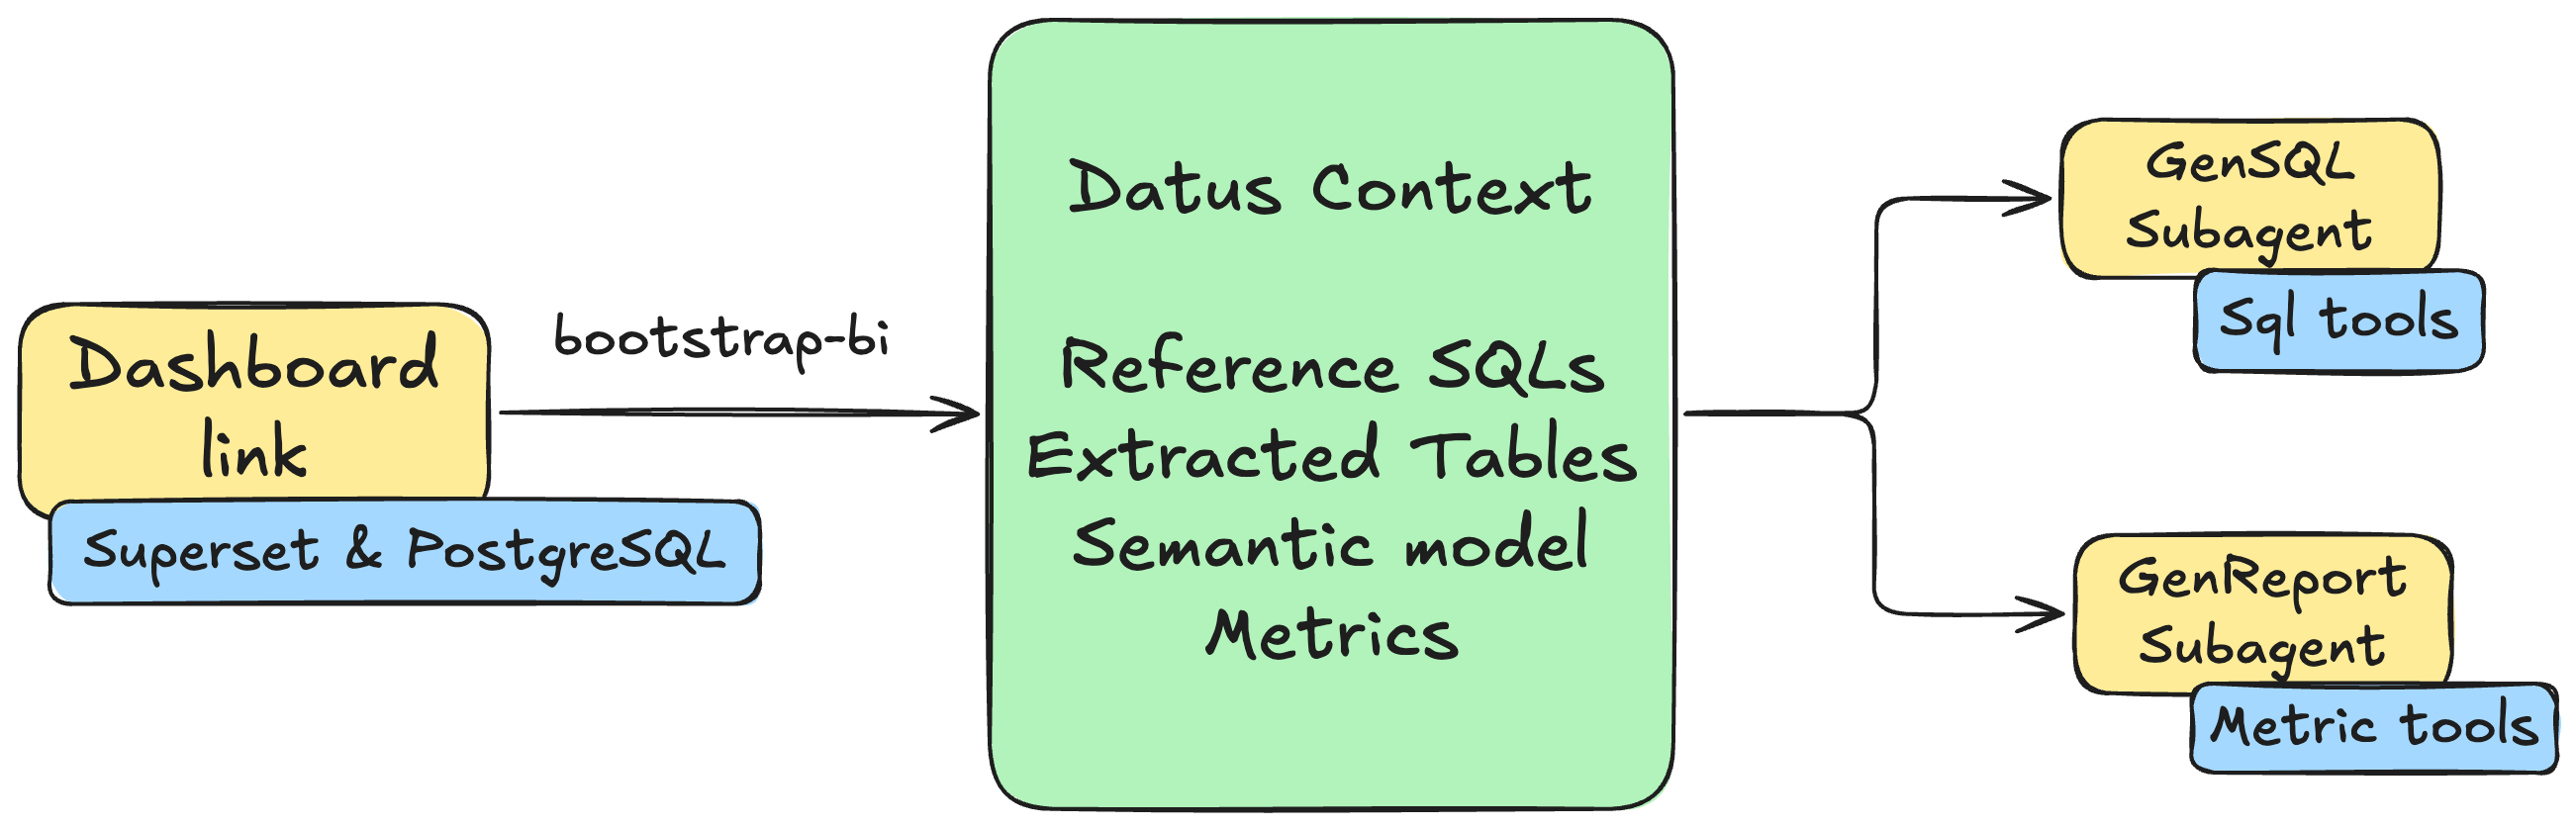
只需一条命令,Datus 就能从现有仪表盘中提取所有上下文——SQL 查询、表关系、指标定义和业务逻辑——并创建像您的仪表盘一样理解数据的 AI 子代理。
Bootstrap 过程会自动生成两个专门的子代理:一个**主子代理**用于在仪表盘语义范围内自助取数与生成 SQL,另一个**归因子代理**用于指标对比、维度归因和根因分析。
前置条件
开始之前,请确保您已具备:
- Docker Desktop 已安装并运行
- Python 3.12 并已安装 Datus
步骤 1:部署 Superset + PostgreSQL
可快速启动一个本地 Superset 环境:
mkdir -p /tmp/datus-superset && cd /tmp/datus-superset
curl -L -o datus-dashboard-copilot-stack-v1.zip https://github.com/Datus-ai/datus-quickstart-data/releases/download/data-engineering-v1/datus-dashboard-copilot-stack-v1.zip
unzip -jo datus-dashboard-copilot-stack-v1.zip '*/superset/docker-compose.yml' '*/superset/superset_config.py'
docker compose up -d
待服务就绪后确认:
现在您可以通过 http://localhost:8088 访问 Superset,默认凭据为 admin/admin。
PostgreSQL 暴露在 127.0.0.1:5433,默认库为 superset_examples,用户名/密码为 superset。
Helm 方式(可选)
如果您更偏好 Kubernetes,也可以使用仓库中的 Helm 部署流程。
步骤 2:配置 Datus
配置 Datus 以连接 PostgreSQL 数据库和 Superset 仪表盘。
更新 agent.yml
将以下配置添加到您的 ~/.datus/conf/agent.yml:
agent:
  services:
    datasources:
      superset:
        type: postgresql
        host: 127.0.0.1
        port: 5433
        username: superset
        password: superset
        database: superset_examples
        schema: public
    semantic_layer:
      metricflow:
        type: metricflow
    bi_platforms:
      superset:
        type: superset
        api_base_url: http://localhost:8088
        username: admin
        password: admin
        dataset_db:
          datasource_ref: superset
          bi_database_name: examples
配置说明
- services.datasources:定义用于 SQL 执行的数据源连接
- services.semantic_layer:注册 metric 与 semantic model 工作流使用的语义适配器
- services.bi_platforms:定义 BI 平台凭据,并将 Superset 中的
examples数据库连接映射到 Datus 的supersetdatasource
Tip
也可以在 REPL 内通过斜杠命令交互式添加:/datasource 添加 SQL 数据源,/services 添加 semantic layer、BI platform 与 scheduler。
步骤 3:从仪表盘 Bootstrap
在 Datus REPL 内使用 /bootstrap-bi 斜杠命令,从 Superset 仪表盘自动生成上下文和子代理。我们将以世界银行数据仪表盘为例。
启动 REPL
设置模型
/bootstrap-bi 会调用 LLM 生成 SQL Summary、语义模型与指标。开始之前先用 /model 选定要使用的模型,详见 模型命令。
运行 /bootstrap-bi
交互流程
以测试集中的 World Bank's Data 看板为例进行初始化。
1. 选择 BI platform
─────────────────────────────── Bootstrap BI ───────────────────────────────
────────────────────────────────────────────────────────────────────────────
  Pick a configured BI platform:
  → superset               superset     http://localhost:8088


────────────────────────────────────────────────────────────────────────────
  ↑↓ navigate   ↵ select   Esc cancel
2. 选择看板
─────────────────────────────── Bootstrap BI ───────────────────────────────
────────────────────────────────────────────────────────────────────────────
filter:
────────────────────────────────────────────────────────────────────────────
    16       Slack Dashboard
    15       COVID Vaccine Dashboard
    14       Unicode Test
    13       FCC New Coder Survey 2018
    12       Featured Charts
    11       Video Game Sales
    10       Sales Dashboard
    8        deck.gl Demo
    7        Misc Charts
    6        USA Births Names
  → 5        World Bank's Data
    9        [ untitled dashboard ]

────────────────────────────────────────────────────────────────────────────
  type to filter   ↑↓ navigate   ↵ select   m manual URL   Esc back
3. 选择用于参考 SQL 的图表
每个选中图表的 SQL 会作为主子代理的 reference SQL。
─────────────────────────────── Bootstrap BI ───────────────────────────────
────────────────────────────────────────────────────────────────────────────
  Select charts for reference SQL (9/9 selected):
  → [x] 281    Treemap (agg)
    [x] 276    % Rural (agg)
    [x] 277    Life Expectancy VS Rural % (agg)
    [x] 274    Most Populated Countries (agg)
    [x] 280    Box plot (agg)
    [x] 278    Rural Breakdown (agg)
    [x] 273    World's Population (agg)
    [x] 279    World's Pop Growth (agg)
    [x] 275    Growth Rate (agg)
────────────────────────────────────────────────────────────────────────────
  ↑↓ navigate   Space toggle   a all   n none   ↵ next   Esc back
4. 选择用于指标提取的图表
这些图表中的聚合表达式会被挖掘成指标定义。默认仅勾选带聚合((agg) 标记)的图表。
─────────────────────────────── Bootstrap BI ───────────────────────────────
────────────────────────────────────────────────────────────────────────────
  Select charts for metrics (9/9 selected):
  → [x] 281    Treemap (agg)
    [x] 276    % Rural (agg)
    [x] 277    Life Expectancy VS Rural % (agg)
    [x] 274    Most Populated Countries (agg)
    [x] 280    Box plot (agg)
    [x] 278    Rural Breakdown (agg)
    [x] 273    World's Population (agg)
    [x] 279    World's Pop Growth (agg)
    [x] 275    Growth Rate (agg)

────────────────────────────────────────────────────────────────────────────
  ↑↓ navigate   Space toggle   a all   n none   ↵ next   Esc back
5. 选择关联的表
─────────────────────────────── Bootstrap BI ───────────────────────────────
────────────────────────────────────────────────────────────────────────────
  Review tables to scope (1/1 selected):
  → [x] public.wb_health_population


────────────────────────────────────────────────────────────────────────────
  ↑↓ navigate   Space toggle   a all   n none   ↵ next   Esc back
6. 选择并发数
后续构建会并行调用 LLM,可根据网络与配额选择线程池大小(默认 3,可加大以加速)。
─────────────────────────────── Bootstrap BI ───────────────────────────────
────────────────────────────────────────────────────────────────────────────
  Pick a thread-pool size for parallel LLM calls:
    1 threads
  → 3 threads
    5 threads
    10 threads
────────────────────────────────────────────────────────────────────────────
  ↑↓ navigate   ↵ select   Esc back
自动化构建
确认上述选择后,Datus 进入自动化构建流程,依次完成元数据爬取、参考 SQL 生成、语义模型构建和指标提取。
1. 元数据爬取
爬取并索引所选表的 schema 信息:
⏺ 💬 Dashboard: World Bank's Data (id=5)

⏺ 💬 Selected 9/9 chart(s); 1 table(s); pool_size=3

⏺ 💬 Crawling metadata for 1 table(s)…

⏺ 🔧 schema_crawl()
  └─ ✓

⏺ 💬 Metadata crawl finished.
2. 生成参考 SQL
针对每个选中的图表,系统生成结构化的 SQL Summary(用途、表、维度、指标、业务意义),写入 subject/sql_summaries/,作为后续 SQL 生成的参考样例:
⏺ 💬 Wrote 9 chart SQL(s) to /Users/liuyufei/.datus/dashboard/superset/superset_world_bank_s_202604281951.sql.

⏺ 💬 Discovering SQL files under /Users/liuyufei/.datus/dashboard/superset/superset_world_bank_s_202604281951.sql (mode=incremental)…

⏺ 💬 Processing 9 SQL item(s) with concurrency=3.

⏺ gen_sql_summary(/Users/liuyufei/.datus/dashboard/superset/superset_world_bank_s_202604281951.sql)
  ⎿  Done (2 tool uses · 20.0s)
⏺ 💬 gen_sql_summary (/Users/liuyufei/.datus/dashboard/superset/superset_world_bank_s_202604281951.sql):


SQL Summary: Population by Region and Country

📋 Overview

This SQL query is sourced from the World Bank's Data Superset dashboard and powers a Treemap chart. It aggregates total population figures grouped by region and country code.

────────────────────────────────────────────────────────────────────────────
🔍 Query Breakdown


  Element         Details
 ━━━━━━━━━━━━━━━━━━━━━━━━━━━━━━━━━━━━━━━━━━━━━━━━━━━━━━━━━━━━━━━━━━━━━━━━━━
  Table           public.wb_health_population
  Metric          SUM('SP_POP_TOTL') — Total population indicator
  Dimensions      region, country_code
  Time Filter     From 1960-01-01 up to 2026-04-28 (full historical range)
  Result Limit    50,000 rows
  Visualization   Treemap chart


────────────────────────────────────────────────────────────────────────────
📊 Business Purpose

This query supports a World Bank population distribution analysis, visualizing how total population is distributed across different world regions and countries over time. The
Treemap layout makes it easy to compare relative population sizes at a glance.

────────────────────────────────────────────────────────────────────────────
💾 Saved File

 • Path: subject/sql_summaries/population_by_region_country_07f5c7b14f0355b0b64183b0993bc45e.yaml
 • Subject Tree: superset/world_bank_s
 • ID: 07f5c7b14f0355b0b64183b0993bc45e

⏺ 💬 Indexed 9 reference SQL item(s).

⏺ 💬 Collected 9 reference SQL identifier(s).
3. 生成语义模型
Datus 综合所有图表 SQL,构建包含度量、维度和关系的语义模型并校验:
⏺ gen_semantic_model(World Bank's Data)
 ⎿  Done (13 tool uses · 96.4s)
⏺ 💬 gen_semantic_model (World Bank's Data):


Semantic Model Generation Summary

Analysis

 • SQL Queries Analyzed: 9 queries from the World Bank's Data dashboard
 • Tables Identified: 1 — public.wb_health_population
 • Column Usage Patterns: Analyzed 4 actively-filtered columns (year, region, country_name, country_code)
4. 提取指标
基于校验通过的语义模型,对图表中的聚合表达式做去重和归并,得到一组核心指标:
⏺ gen_metrics(World Bank's Data)
  ⎿  Done (18 tool uses · 64.0s)
⏺ 💬 gen_metrics (World Bank's Data):

Metric Generation Summary

Analyzed: 9 SQL queries from the World Bank's Data dashboard (public.wb_health_population)

Deduplication Result: 9 queries → 4 unique aggregation patterns → 4 core metrics
输出
Bootstrap 完成后,您将获得可直接使用的子代理:
⏺ save_subagents(superset_world_bank_s)
  ⎿  Done (2 tool uses · 0.0s)
⏺ 💬 Sub-Agent build successful.
> /agent
───────────────────────────── Agent Management ─────────────────────────────
   Custom   Built-in    (Tab or ←/→ to switch)
────────────────────────────────────────────────────────────────────────────
    superset_world_bank_s
    superset_world_bank_s_attribution
    + Add agent…

────────────────────────────────────────────────────────────────────────────
  ↑↓ navigate   Enter set as current   e edit   a add   d delete   Tab/←→ switch   Esc back   Ctrl+C cancel
步骤 4:使用生成的子代理
Bootstrap 一次生成两个子代理:用于自助取数的**主子代理**,以及面向指标分析的**归因子代理**。两者均可通过 @Agent <name>(例如 @Agent superset_world_bank_s)直接调用,也可在 /agent 中切换为当前默认 agent。
SQL 取数 — 主子代理
主子代理基于仪表盘的表与参考 SQL 生成查询并取数,适合临时分析、明细取数等场景。
⏴ superset_world_bank_s(Top 10 countries by life expectancy in 2020 using World Bank data)
  ⎿  Done ✓ (7 tool uses · 42.9s)


🌍 Top 10 Countries by Life Expectancy

▌ ⚠️ Note: The dataset only contains data up to 2013. Year 2020 is not available — results below are for the most recent available year: 2013.

────────────────────────────────────────────────────────────────────────────
🏆 Top 10 Countries by Life Expectancy at Birth (2013)


  Rank   Country                   Region                       Life Expectancy
 ━━━━━━━━━━━━━━━━━━━━━━━━━━━━━━━━━━━━━━━━━━━━━━━━━━━━━━━━━━━━━━━━━━━━━━━━━━━━━━━
  🥇 1   🇭🇰 Hong Kong SAR, China   East Asia & Pacific          83.83 yrs
  🥈 2   🇯🇵 Japan                  East Asia & Pacific          83.33 yrs
  🥉 3   🇮🇸 Iceland                Europe & Central Asia        83.12 yrs
  4      🇨🇭 Switzerland            Europe & Central Asia        82.75 yrs
  5      🇪🇸 Spain                  Europe & Central Asia        82.43 yrs
  6      🇱🇮 Liechtenstein          Europe & Central Asia        82.38 yrs
  7      🇸🇬 Singapore              East Asia & Pacific          82.35 yrs
  8      🇮🇹 Italy                  Europe & Central Asia        82.29 yrs
  9      🇦🇺 Australia              East Asia & Pacific          82.20 yrs
  10     🇮🇱 Israel                 Middle East & North Africa   82.06 yrs

────────────────────────────────────────────────────────────────────────────
📌 Key Insights

 • 🥇 Hong Kong SAR, China leads globally at 83.83 years
 • 🌏 East Asia & Pacific dominates with 4 out of 10 top countries (Hong Kong, Japan, Singapore, Australia)
 • 🌍 Europe & Central Asia is strongly represented with 5 entries (Iceland, Switzerland, Spain, Liechtenstein, Italy)
 • All top 10 countries exceed 82 years of life expectancy at birth
 • 🇮🇱 Israel is the sole representative from the Middle East & North Africa region
归因分析 — 归因子代理
归因子代理面向指标和语义模型工作,专注于指标对比、维度重要性排序与增量贡献归因,适合回答「为什么」类问题。其能力包括:
- 自动维度重要性排序 —— 识别哪些维度对指标变化影响最大
- 增量贡献计算 —— 量化每个因素对整体变化的贡献
- 根因识别 —— 精确定位驱动指标变动的具体值
> @Agent superset_world_bank_s_attribution compare 2014 and 2004, find the reason of population growth
分析生成包含关键发现的完整报告:
⏴ superset_world_bank_s_attribution(Attribution analysis for population growth between 2004 and 2014 using World Bank data)
  ⎿  Done ✓ (15 tool uses · 71.3s)


🌍 World Population Growth: 2004 vs 2014 — Attribution Analysis

Global population grew from ~6.41 billion (2004) to ~7.24 billion (2014), an increase of +825 million people (+12.7%). Here's what drove it:

────────────────────────────────────────────────────────────────────────────

📊 Population by Region


  Region                       2004    2014    Δ Growth   Δ %
 ━━━━━━━━━━━━━━━━━━━━━━━━━━━━━━━━━━━━━━━━━━━━━━━━━━━━━━━━━━━━━━━━━━━
  East Asia & Pacific          2.09B   2.24B   +148.6M    +7.1%
  South Asia                   1.49B   1.72B   +234.4M    +15.8%
  Europe & Central Asia        870M    903M    +32.9M     +3.8%
  Sub-Saharan Africa           742M    974M    +231.9M    +31.2% 🔴
  Latin America & Caribbean    556M    626M    +70.8M     +12.7%
  Middle East & North Africa   340M    417M    +77.5M     +22.8%
  North America                325M    354M    +29.6M     +9.1%


────────────────────────────────────────────────────────────────────────────

🔍 Root Cause Attribution

1. 🍼 Fertility Rate — Top Driver (Score: 8.77)

The single most powerful factor. Sub-Saharan Africa (~5.0+ births/woman) and South Asia (~2.8) sustained large birth cohorts. Even with modest fertility declines, the sheer base
population size translated into massive absolute additions.

2. 👶 Infant Mortality Rate Decline — Driver #2 (Score: 1.65)

More children survived to adulthood, compounding population growth:

 • South Asia: 57.8 → ~39.3 deaths/1,000 births (−32%)
 • Sub-Saharan Africa: Still high (~71.5), but declining — more children surviving

3. 🌾 Rural Population Growth Rate — Driver #3 (Score: 1.65)

High rural growth (especially Sub-Saharan Africa and South Asia) correlates with higher fertility norms and limited access to family planning services.

4. 🔄 Net Migration — Minor Factor (Score: 1.0)

Redistributes population globally but has minimal impact on total world population.
报告包括:
- 整体增长指标 - 总人口、增长率和农村人口百分比的对比
- 主要区域贡献者 - 哪些区域推动了人口增长最多
- 主要国家贡献者 - 各国对变化的贡献
- 结论 - 解释指标变动的关键洞察摘要
子代理对比
/bootstrap-bi 一次生成两个子代理,分工互补:
| 子代理 | 命名约定 | 适用场景 | 工作上下文 |
|---|---|---|---|
| 主子代理 | {platform}_{dashboard} |
自助取数、临时查询、明细分析 | 仪表盘的表 + 参考 SQL + 语义模型 |
| 归因子代理 | {platform}_{dashboard}_attribution |
指标对比、根因分析、增量贡献归因 | 仪表盘的指标 + 语义模型 |
需要写 SQL 的问题交给主子代理;需要回答「为什么变化」「哪个维度影响最大」类问题,交给归因子代理。
下一步
现在您已经拥有了由仪表盘驱动的子代理,可以探索更多功能: