Dashboard Copilot
Transform your BI dashboards into intelligent AI subagents with a single command. This guide walks you through deploying Superset with PostgreSQL, configuring Datus, and using the bootstrap-bi command to automatically generate context and subagents from your dashboard.
Why Dashboard Copilot?
Traditional BI dashboards are static - they show predefined charts and metrics, but users cannot ask follow-up questions or explore data beyond what's been pre-built. Datus Dashboard Copilot transforms these static dashboards into dynamic analysis copilots that can:
- Answer ad-hoc questions using the same data and business logic as your dashboard
- Perform root cause analysis when metrics change unexpectedly
- Generate new SQL queries that stay consistent with your dashboard's semantic model
- Provide attribution analysis to explain what's driving metric changes
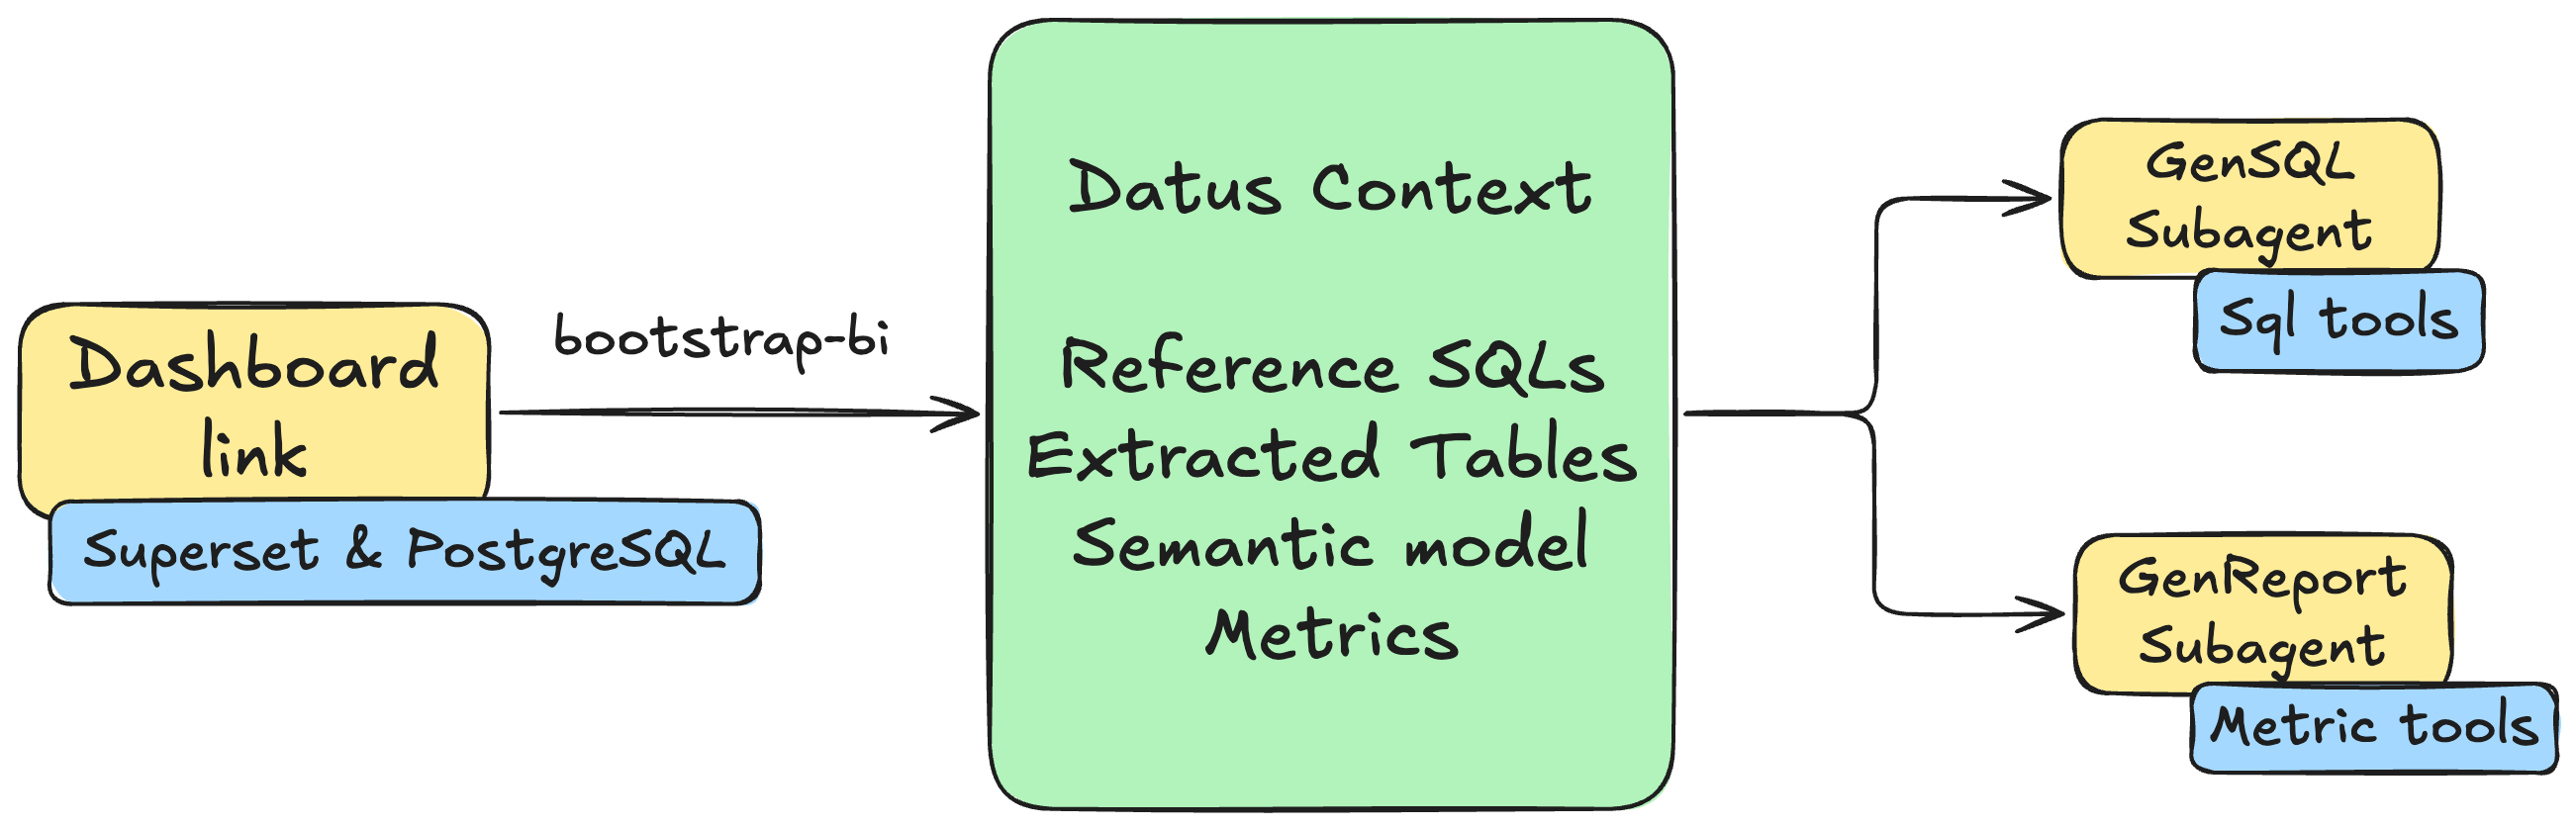
With one command, Datus extracts all the context from your existing dashboard - the SQL queries, table relationships, metrics definitions, and business logic - and creates AI subagents that understand your data as well as your dashboard does.
The bootstrap process automatically generates two specialized subagents: a main subagent for self-service SQL generation within the dashboard's semantic scope, and an attribution subagent for metric comparison, dimension-level attribution, and root-cause analysis.
Prerequisites
Before you begin, ensure you have:
- Docker Desktop (or Docker Engine) with Docker Compose
- Python 3.12 with Datus installed
Step 1: Deploy Superset + PostgreSQL
For a fast local bootstrap, use this Compose stack:
mkdir -p /tmp/datus-superset && cd /tmp/datus-superset
curl -L -o datus-dashboard-copilot-stack-v1.zip https://github.com/Datus-ai/datus-quickstart-data/releases/download/data-engineering-v1/datus-dashboard-copilot-stack-v1.zip
unzip -jo datus-dashboard-copilot-stack-v1.zip '*/superset/docker-compose.yml' '*/superset/superset_config.py'
docker compose up -d
Wait until services are healthy:
You can now access Superset at http://localhost:8088 with default credentials admin/admin.
PostgreSQL is exposed at 127.0.0.1:5433 with default DB superset_examples, user/password superset.
Helm path (optional)
If you still prefer Kubernetes, you can use the previous Helm flow in a dedicated local environment.
Step 2: Configure Datus
Configure Datus to connect to both the PostgreSQL database and Superset dashboard.
Update agent.yml
Add the following configuration to your ~/.datus/conf/agent.yml:
agent:
  services:
    datasources:
      superset:
        type: postgresql
        host: 127.0.0.1
        port: 5433
        username: superset
        password: superset
        database: superset_examples
        schema: public
    semantic_layer:
      metricflow:
        type: metricflow
    bi_platforms:
      superset:
        type: superset
        api_base_url: http://localhost:8088
        username: admin
        password: admin
        dataset_db:
          datasource_ref: superset
          bi_database_name: examples
Configuration Sections
- services.datasources: Defines datasource connections for SQL execution
- services.semantic_layer: Registers the semantic adapter used by metric and semantic-model workflows
- services.bi_platforms: Defines the BI platform credentials and maps Superset's
examplesdatabase connection to the Datussupersetdatasource
Tip
You can also add entries interactively from inside the REPL via slash commands: /datasource for SQL datasources, and /services for semantic layer, BI platform, and scheduler entries.
Step 3: Bootstrap from Dashboard
Now use the in-REPL /bootstrap-bi slash command to automatically generate context and subagents from your Superset dashboard. We'll use the World Bank's Data dashboard as an example.
Launch the REPL
Set the Model
/bootstrap-bi calls the LLM to produce SQL summaries, the semantic model, and metrics. Pick the model first via /model — see Model Command for the full provider list.
Run /bootstrap-bi
Interactive Flow
We'll walk through bootstrap using the World Bank's Data dashboard from the Superset example set.
1. Pick a BI platform
─────────────────────────────── Bootstrap BI ───────────────────────────────
────────────────────────────────────────────────────────────────────────────
  Pick a configured BI platform:
  → superset               superset     http://localhost:8088


────────────────────────────────────────────────────────────────────────────
  ↑↓ navigate   ↵ select   Esc cancel
2. Pick a dashboard
─────────────────────────────── Bootstrap BI ───────────────────────────────
────────────────────────────────────────────────────────────────────────────
filter:
────────────────────────────────────────────────────────────────────────────
    16       Slack Dashboard
    15       COVID Vaccine Dashboard
    14       Unicode Test
    13       FCC New Coder Survey 2018
    12       Featured Charts
    11       Video Game Sales
    10       Sales Dashboard
    8        deck.gl Demo
    7        Misc Charts
    6        USA Births Names
  → 5        World Bank's Data
    9        [ untitled dashboard ]

────────────────────────────────────────────────────────────────────────────
  type to filter   ↑↓ navigate   ↵ select   m manual URL   Esc back
3. Pick charts for reference SQL
The SQL behind each selected chart will be saved as a reference example for the main subagent.
─────────────────────────────── Bootstrap BI ───────────────────────────────
────────────────────────────────────────────────────────────────────────────
  Select charts for reference SQL (9/9 selected):
  → [x] 281    Treemap (agg)
    [x] 276    % Rural (agg)
    [x] 277    Life Expectancy VS Rural % (agg)
    [x] 274    Most Populated Countries (agg)
    [x] 280    Box plot (agg)
    [x] 278    Rural Breakdown (agg)
    [x] 273    World's Population (agg)
    [x] 279    World's Pop Growth (agg)
    [x] 275    Growth Rate (agg)
────────────────────────────────────────────────────────────────────────────
  ↑↓ navigate   Space toggle   a all   n none   ↵ next   Esc back
4. Pick charts for metrics
The aggregations in these charts will be mined for metric definitions. By default only charts with aggregations are pre-selected.
─────────────────────────────── Bootstrap BI ───────────────────────────────
────────────────────────────────────────────────────────────────────────────
  Select charts for metrics (9/9 selected):
  → [x] 281    Treemap (agg)
    [x] 276    % Rural (agg)
    [x] 277    Life Expectancy VS Rural % (agg)
    [x] 274    Most Populated Countries (agg)
    [x] 280    Box plot (agg)
    [x] 278    Rural Breakdown (agg)
    [x] 273    World's Population (agg)
    [x] 279    World's Pop Growth (agg)
    [x] 275    Growth Rate (agg)

────────────────────────────────────────────────────────────────────────────
  ↑↓ navigate   Space toggle   a all   n none   ↵ next   Esc back
5. Review tables in scope
─────────────────────────────── Bootstrap BI ───────────────────────────────
────────────────────────────────────────────────────────────────────────────
  Review tables to scope (1/1 selected):
  → [x] public.wb_health_population


────────────────────────────────────────────────────────────────────────────
  ↑↓ navigate   Space toggle   a all   n none   ↵ next   Esc back
6. Pick a thread-pool size
The build phase issues parallel LLM calls. Increase the pool size to speed things up if your provider quota allows. The default is 3.
─────────────────────────────── Bootstrap BI ───────────────────────────────
────────────────────────────────────────────────────────────────────────────
  Pick a thread-pool size for parallel LLM calls:
    1 threads
  → 3 threads
    5 threads
    10 threads
────────────────────────────────────────────────────────────────────────────
  ↑↓ navigate   ↵ select   Esc back
Automated Build
After the picker confirms, Datus runs an automated build pipeline — metadata crawl, reference SQL, semantic model, and metrics extraction.
1. Metadata crawl
Crawls and indexes the schema of the in-scope tables:
⏺ 💬 Dashboard: World Bank's Data (id=5)

⏺ 💬 Selected 9/9 chart(s); 1 table(s); pool_size=3

⏺ 💬 Crawling metadata for 1 table(s)…

⏺ 🔧 schema_crawl()
  └─ ✓

⏺ 💬 Metadata crawl finished.
2. Reference SQL
For each selected chart, Datus generates a structured SQL Summary (purpose, table, dimensions, metrics, business intent) and writes it under subject/sql_summaries/ so the main subagent can use them as few-shot references:
⏺ 💬 Wrote 9 chart SQL(s) to /Users/liuyufei/.datus/dashboard/superset/superset_world_bank_s_202604281951.sql.

⏺ 💬 Discovering SQL files under /Users/liuyufei/.datus/dashboard/superset/superset_world_bank_s_202604281951.sql (mode=incremental)…

⏺ 💬 Processing 9 SQL item(s) with concurrency=3.

⏺ gen_sql_summary(/Users/liuyufei/.datus/dashboard/superset/superset_world_bank_s_202604281951.sql)
  ⎿  Done (2 tool uses · 20.0s)
⏺ 💬 gen_sql_summary (/Users/liuyufei/.datus/dashboard/superset/superset_world_bank_s_202604281951.sql):


SQL Summary: Population by Region and Country

📋 Overview

This SQL query is sourced from the World Bank's Data Superset dashboard and powers a Treemap chart. It aggregates total population figures grouped by region and country code.

────────────────────────────────────────────────────────────────────────────
🔍 Query Breakdown


  Element         Details
 ━━━━━━━━━━━━━━━━━━━━━━━━━━━━━━━━━━━━━━━━━━━━━━━━━━━━━━━━━━━━━━━━━━━━━━━━━━
  Table           public.wb_health_population
  Metric          SUM('SP_POP_TOTL') — Total population indicator
  Dimensions      region, country_code
  Time Filter     From 1960-01-01 up to 2026-04-28 (full historical range)
  Result Limit    50,000 rows
  Visualization   Treemap chart


────────────────────────────────────────────────────────────────────────────
📊 Business Purpose

This query supports a World Bank population distribution analysis, visualizing how total population is distributed across different world regions and countries over time. The
Treemap layout makes it easy to compare relative population sizes at a glance.

────────────────────────────────────────────────────────────────────────────
💾 Saved File

 • Path: subject/sql_summaries/population_by_region_country_07f5c7b14f0355b0b64183b0993bc45e.yaml
 • Subject Tree: superset/world_bank_s
 • ID: 07f5c7b14f0355b0b64183b0993bc45e

⏺ 💬 Indexed 9 reference SQL item(s).

⏺ 💬 Collected 9 reference SQL identifier(s).
3. Semantic model
Datus consolidates all chart SQLs into a semantic model with measures, dimensions, and relationships, and validates it:
⏺ gen_semantic_model(World Bank's Data)
 ⎿  Done (13 tool uses · 96.4s)
⏺ 💬 gen_semantic_model (World Bank's Data):


Semantic Model Generation Summary

Analysis

 • SQL Queries Analyzed: 9 queries from the World Bank's Data dashboard
 • Tables Identified: 1 — public.wb_health_population
 • Column Usage Patterns: Analyzed 4 actively-filtered columns (year, region, country_name, country_code)
4. Metric extraction
Based on the validated semantic model, the chart aggregations are deduped and merged into a small set of core metrics:
⏺ gen_metrics(World Bank's Data)
  ⎿  Done (18 tool uses · 64.0s)
⏺ 💬 gen_metrics (World Bank's Data):

Metric Generation Summary

Analyzed: 9 SQL queries from the World Bank's Data dashboard (public.wb_health_population)

Deduplication Result: 9 queries → 4 unique aggregation patterns → 4 core metrics
Output
When bootstrap finishes, both subagents are saved and available for invocation via @Agent <name> or by switching the default through /agent:
⏺ save_subagents(superset_world_bank_s)
  ⎿  Done (2 tool uses · 0.0s)
⏺ 💬 Sub-Agent build successful.
> /agent
───────────────────────────── Agent Management ─────────────────────────────
   Custom   Built-in    (Tab or ←/→ to switch)
────────────────────────────────────────────────────────────────────────────
    superset_world_bank_s
    superset_world_bank_s_attribution
    + Add agent…

────────────────────────────────────────────────────────────────────────────
  ↑↓ navigate   Enter set as current   e edit   a add   d delete   Tab/←→ switch   Esc back   Ctrl+C cancel
Step 4: Use the Generated Subagents
/bootstrap-bi produces two subagents at once: a main subagent for self-service SQL, and an attribution subagent for metric-level analysis. Both are invocable with @Agent <name> (for example, @Agent superset_world_bank_s) and you can switch the default agent through /agent.
Self-service SQL — main subagent
The main subagent generates and runs SQL grounded in the dashboard's tables and reference SQL — ideal for ad-hoc queries and detail lookups.
⏴ superset_world_bank_s(Top 10 countries by life expectancy in 2020 using World Bank data)
  ⎿  Done ✓ (7 tool uses · 42.9s)


🌍 Top 10 Countries by Life Expectancy

▌ ⚠️ Note: The dataset only contains data up to 2013. Year 2020 is not available — results below are for the most recent available year: 2013.

────────────────────────────────────────────────────────────────────────────
🏆 Top 10 Countries by Life Expectancy at Birth (2013)


  Rank   Country                   Region                       Life Expectancy
 ━━━━━━━━━━━━━━━━━━━━━━━━━━━━━━━━━━━━━━━━━━━━━━━━━━━━━━━━━━━━━━━━━━━━━━━━━━━━━━━
  🥇 1   🇭🇰 Hong Kong SAR, China   East Asia & Pacific          83.83 yrs
  🥈 2   🇯🇵 Japan                  East Asia & Pacific          83.33 yrs
  🥉 3   🇮🇸 Iceland                Europe & Central Asia        83.12 yrs
  4      🇨🇭 Switzerland            Europe & Central Asia        82.75 yrs
  5      🇪🇸 Spain                  Europe & Central Asia        82.43 yrs
  6      🇱🇮 Liechtenstein          Europe & Central Asia        82.38 yrs
  7      🇸🇬 Singapore              East Asia & Pacific          82.35 yrs
  8      🇮🇹 Italy                  Europe & Central Asia        82.29 yrs
  9      🇦🇺 Australia              East Asia & Pacific          82.20 yrs
  10     🇮🇱 Israel                 Middle East & North Africa   82.06 yrs

────────────────────────────────────────────────────────────────────────────
📌 Key Insights

 • 🥇 Hong Kong SAR, China leads globally at 83.83 years
 • 🌏 East Asia & Pacific dominates with 4 out of 10 top countries (Hong Kong, Japan, Singapore, Australia)
 • 🌍 Europe & Central Asia is strongly represented with 5 entries (Iceland, Switzerland, Spain, Liechtenstein, Italy)
 • All top 10 countries exceed 82 years of life expectancy at birth
 • 🇮🇱 Israel is the sole representative from the Middle East & North Africa region
Attribution analysis — attribution subagent
The attribution subagent works against metrics and the semantic model — ideal for "why did this change?" questions. It provides:
- Automatic dimension importance ranking — identifies which dimensions most influence metric changes
- Delta contribution calculation — quantifies each factor's contribution to the overall change
- Root cause identification — pinpoints specific values driving metric movement
> @Agent superset_world_bank_s_attribution compare 2014 and 2004, find the reason of population growth
The analysis produces a structured Markdown report:
⏴ superset_world_bank_s_attribution(Attribution analysis for population growth between 2004 and 2014 using World Bank data)
  ⎿  Done ✓ (15 tool uses · 71.3s)


🌍 World Population Growth: 2004 vs 2014 — Attribution Analysis

Global population grew from ~6.41 billion (2004) to ~7.24 billion (2014), an increase of +825 million people (+12.7%). Here's what drove it:

────────────────────────────────────────────────────────────────────────────

📊 Population by Region


  Region                       2004    2014    Δ Growth   Δ %
 ━━━━━━━━━━━━━━━━━━━━━━━━━━━━━━━━━━━━━━━━━━━━━━━━━━━━━━━━━━━━━━━━━━━
  East Asia & Pacific          2.09B   2.24B   +148.6M    +7.1%
  South Asia                   1.49B   1.72B   +234.4M    +15.8%
  Europe & Central Asia        870M    903M    +32.9M     +3.8%
  Sub-Saharan Africa           742M    974M    +231.9M    +31.2% 🔴
  Latin America & Caribbean    556M    626M    +70.8M     +12.7%
  Middle East & North Africa   340M    417M    +77.5M     +22.8%
  North America                325M    354M    +29.6M     +9.1%


────────────────────────────────────────────────────────────────────────────

🔍 Root Cause Attribution

1. 🍼 Fertility Rate — Top Driver (Score: 8.77)

The single most powerful factor. Sub-Saharan Africa (~5.0+ births/woman) and South Asia (~2.8) sustained large birth cohorts. Even with modest fertility declines, the sheer base
population size translated into massive absolute additions.

2. 👶 Infant Mortality Rate Decline — Driver #2 (Score: 1.65)

More children survived to adulthood, compounding population growth:

 • South Asia: 57.8 → ~39.3 deaths/1,000 births (−32%)
 • Sub-Saharan Africa: Still high (~71.5), but declining — more children surviving

3. 🌾 Rural Population Growth Rate — Driver #3 (Score: 1.65)

High rural growth (especially Sub-Saharan Africa and South Asia) correlates with higher fertility norms and limited access to family planning services.

4. 🔄 Net Migration — Minor Factor (Score: 1.0)

Redistributes population globally but has minimal impact on total world population.
The report includes:
- Overall growth metrics — comparison of total population, growth rate, and rural population percentage
- Top regional contributors — which regions drove the most population increase
- Top country contributors — individual country contributions
- Conclusion — key insights explaining the metric movement
Subagent comparison
/bootstrap-bi produces two complementary subagents:
| Subagent | Naming | When to use | Working context |
|---|---|---|---|
| Main | {platform}_{dashboard} |
Ad-hoc queries, detail lookups, self-service SQL | Dashboard tables + reference SQL + semantic model |
| Attribution | {platform}_{dashboard}_attribution |
Metric comparison, root-cause analysis, delta-contribution attribution | Dashboard metrics + semantic model |
Send "what is X?" / "show me Y" questions to the main subagent; send "why did Z change?" / "which dimension drove the move?" questions to the attribution subagent.
Next Steps
Now that you have your dashboard-powered subagents, explore more:
- Subagent Introduction - Learn more about subagent capabilities
- Knowledge Base - Manage and extend your context
- Metrics - Define and manage your metrics
- Semantic Models - Customize your semantic layer