HTML Report Generation Guide
Overview
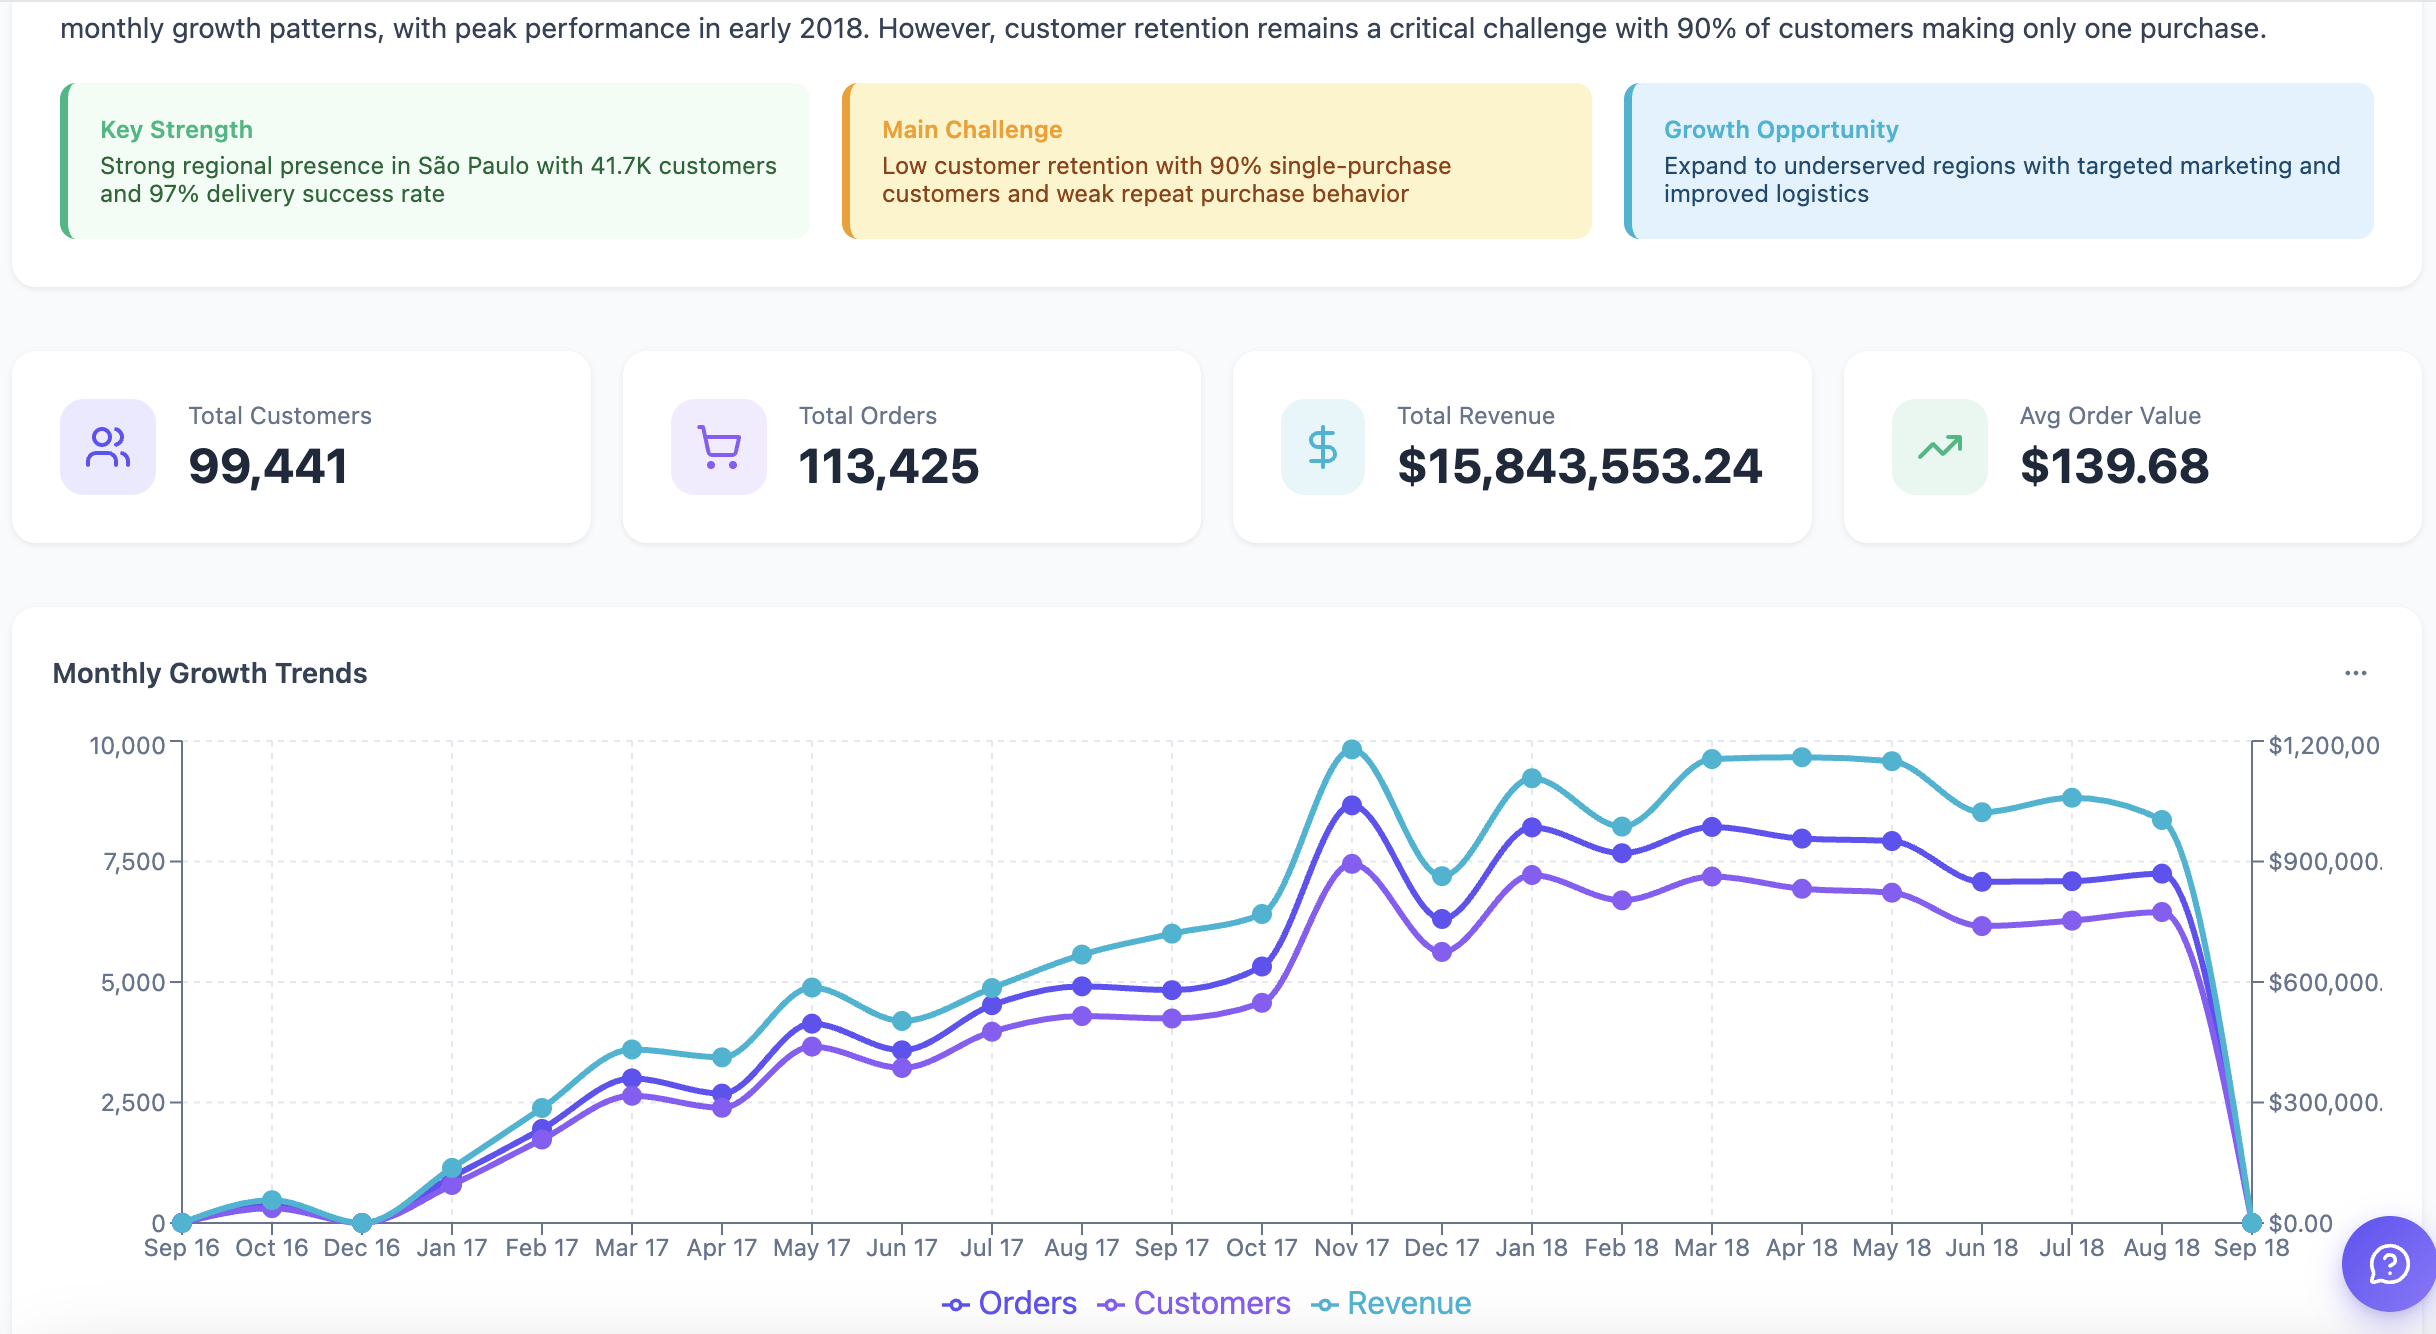
gen_visual_report turns a question — "how did Q4 revenue do?", "explain merchant churn in H2" — into a self-contained HTML report: a scrollable web page with an executive summary, KPI cards, charts, tables, and narrative paragraphs. In Datus-CLI mode the page opens in your browser automatically; in Datus-SaaS it shows up inline in the chat.
An HTML report is a long-form, narrative answer with the data baked in at build time. There are no filters and no live re-querying once the report is built. For interactive BI dashboards on Superset / Grafana, use gen_dashboard instead.
If you'd rather have a plain-text Markdown report (no HTML rendering, no charts), use the gen_report agent instead.
Quick Start
Activate gen_visual_report as your current agent — the legacy /gen_visual_report ... slash invocation was removed in favor of /agent-based selection:
(Or run /agent with no args to pick it from the unified agent TUI — Enter to edit, s to set as default.) Once active, just describe what you want — state the question, the time window, and the breakdowns you care about:
Give me a Q4 2025 revenue report. Show monthly trend, top 10 regions, and a YoY comparison vs Q4 2024.
Analyze merchant churn for 2025 H2, segment by tenure bucket, and give key findings and recommendations.
To edit an existing report, reference it by display name or by its short id:
Start from a Metric or Your Own SQL
gen_visual_report accepts two equally valid starting points:
-
From metrics — reference an existing metric with
@Metrics <subject>.<group>.<metric>(three segments — subject tree path + metric name). The agent will pull its definition, dimensions, and time windows from your semantic layer. Best when your project already has a curated metric registry (see Generate Metrics for how to create them). -
From SQL — paste the SQL you want the report built on. The agent treats your query as the data source, executes it, and assembles the narrative + charts around the result. Best for one-off analyses or when the metric you need doesn't exist yet.
You can also mix the two — point at a metric for the headline KPI and supply ad-hoc SQL for a specific drilldown.
How a Report Gets Built
graph LR
    A[Your question] --> B[Discover relevant<br/>metrics & tables]
    B --> C[Run SQL queries<br/>and save results]
    C --> D[Compose the<br/>narrative + charts]
    D --> E[Open in your browser]
The agent reads your question, looks up the metrics and tables that are most relevant, runs the SQL it needs, then composes the executive summary, KPI cards, charts, tables, and recommendations into a single HTML report. You can re-invoke gen_visual_report later to edit the same report in place.
Edit Section by Section
Every report is built out of independent modules — KPI banner, individual charts, data tables, recommendations block, footer. You can iterate on just one without touching anything else:
Swap the revenue trend chart in q4_2025_revenue_analysis to monthly aggregation
Add a YoY column to the regional breakdown table
Drop the recommendations section, it's not needed for this audience
Update the executive summary to emphasize the H2 turnaround
Each call is a surgical change. The agent locates the affected module, edits it, re-runs only the queries that changed, and leaves everything else alone — so the rest of the layout, narrative, and figures stay exactly as you reviewed them. This makes the report cheap to iterate on: refine a wording, swap a chart type, add a column, or remove a section in a single back-and-forth, without ever rewriting the whole thing.
What the Agent Has Access To
To build the report, gen_visual_report uses everything that's already wired into your project:
- Your semantic layer — defined metrics and dimensions take precedence over ad-hoc SQL whenever they fit the question.
- Your databases — the agent reads schema, samples values, and runs the queries against your configured datasources.
- Your knowledge base — curated reference SQL and business glossary entries are consulted before the agent writes anything from scratch.
- Previous reports — when you ask the agent to use an existing report as inspiration, it can read that report's data and components.
You don't call any of this yourself — just write the prompt.
Configuration
gen_visual_report works out of the box; no configuration is required. The settings below are optional overrides in agent.yml:
agent:
  agentic_nodes:
    gen_visual_report:
      model: claude              # Optional: defaults to the configured model
      max_turns: 30              # Optional: defaults to 30
| Parameter | Required | Description | Default |
|---|---|---|---|
model |
No | LLM model to use | Configured default |
max_turns |
No | Maximum agent iterations before the run stops | 30 |
Tips for Better Prompts
You'll get a sharper report when your prompt includes:
- The question — "explain merchant churn", "compare Q4 revenue YoY".
- The time window — "Q4 2025", "last 90 days", "2025 H2".
- The scope — region, segment, product line, or team.
- The breakdowns you want — "by region", "by tenure bucket", "monthly trend".
If you skip any of these the agent will guess from your project's metrics and ask only when intent is genuinely ambiguous.